Download
1 / 24
250 likes | 429 Views
Measuring Progress. Dr Paul Jelfs, Branch Head Health Information and Social Analysis Branch Australian Bureau of Statistics. Is life in Australia getting better?. Who is it getting better for? Everyone? Some groups? Is it getting better for some at the expense of others?.

E N D
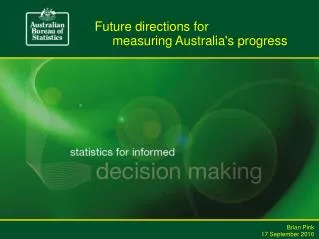
Measuring Progress Dr Paul Jelfs, Branch Head Health Information and Social Analysis Branch Australian Bureau of Statistics
Is life in Australia getting better? • Who is it getting better for? • Everyone? • Some groups? • Is it getting better for some at the expense of others?
What is progress? “the level of social progress or development in any country is a matter of considerable conjecture and a high degree of subjective appreciation”Donald J. Johnston, 2006 • Direct social influences on the changing wellbeing of a population • The structure and growth of the economy • The environment – as a direct influence on the wellbeing of people and the economy, as well as independent value
Perspectives on measuring progress “… the gross national product measures everything, in short, except that which makes life worthwhile.”Robert Kennedy, 1968 “The better an electorate is able to hold its policy makers accountable through evidence of their performance, the greater the incentive for policy makers to make better policy. And smarter indicators of progress could help society to achieve more relevant goals with fewer resources.”OECD
Measuring Progress “Not everything that is important can be measured, and not everything that can be measured is important.”Albert Einstein There are many different approached to measuring progress, including: • Life satisfaction or happiness • A single composite indicator e.g. Human Development Index and Genuine Progress Indicator • A set of integrated accounts that presents social economic and environmental data in a unified system • Suite of indicators to inform judgements
“Australia's per capita carbon footprint puts it at No. 1” “Household wealth plummets by 25%” “Making plans for a healthier nation” “Illawarra unemployment rate hits nearly 10%” “Demand for home loans grows for 7th straight month”
MAP - A Brief History • first released 2002 - Awarded The Bulletin’s Smart 100, 2003 • subsequent reports 2004 and 2006 • headline indicators updated annually on the ABS website (from 2005) • most recent update April 2009
Society Health Education and training Work Culture and leisure Family, community and social cohesion Crime Communication Transport Democracy, governance and citizenship The Economy National income Economic hardship National wealth Housing Productivity Competitiveness and openness Inflation The Environment The natural landscape The air and atmosphere Oceans and estuaries
Comparative national and local initiatives • Community Indicators Victoria • Tasmania Together • NSW state plan • The Basin Plan (Murray-Darling Basin Authority) • COAG process • Spotlight on the Pilbara
International comparisons • OECD Measuring the progress of societies • OECD 3rd World Forum October 2009 • Canadian Index of Wellbeing • Community Accounts: Government of Newfoundland and Labrador, Canada
Conceptual development of MAP Areas where development is required are: • Housing – affordability, housing as an economic resource, occupancy rates • Environment – appropriate measures, data availability • Democracy, governance and citizenship – measuring attitudinal perspectives • Crime and Security – broadening the focus to include security measures at a national level, data availability
Wouldn’t it be good if… • We could measure subjective indicators of wellbeing • Apply the MAP indicators to smaller populations or interest groups • MAP could be used as an evidence base for change at a local level
Conceptual development • An Expert Reference Group is being assembled to discuss the conceptual development of MAP • The Expert Reference Group will be made up of a number of prominent experts in related fields
Turning MAP into an electronic product Challenges: • Presenting a complex report in a manageable way • Keeping the relevant background information accessible • Meeting the needs of a broad range of clients • Engaging a broad audience with varying levels of statistical knowledge
Turning MAP into an electronic product Advantages • Improved navigation • Improved graphing • Key updates annually Existing MAP website Prototype of redevelopment
Questions? • Visit our display • Come to the ‘Measuring Progress’ workshop • Visit our website www.abs.gov.au/about/progress
Contact details Paul Jelfs, Branch Head paul.jelfs@abs.gov.au Phone: 02 6252 6690 Tracey Chester, MAP Project leader tracey.chester@abs.gov.au Phone: 02 6252 5609