Download
1 / 18
180 likes | 274 Views
Explore the global impact of climate change trends, including sea level rise, precipitation changes, and temperature fluctuations. Learn how climate models simulate these trends and the challenges in forecasting rainfall accurately. Discover the contributions of greenhouse gases to observed warming and the potential implications for the future.

E N D
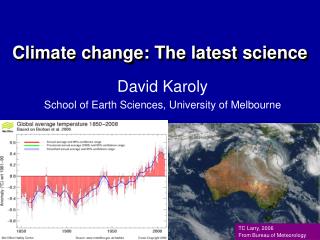
Climate Change Science -- the Present Stuart Godfrey (retired CSIRO Oceanographer) What is it like being a Greenhouse climate scientist? Perth, WA river inflows -- a wake-up call Are such trends global, and if so, why? Sea level rise, thermal expansion and icemelt Do models reproduce the trends we see? GLOBAL WARMING IS A LEARNING EXPERIENCE!
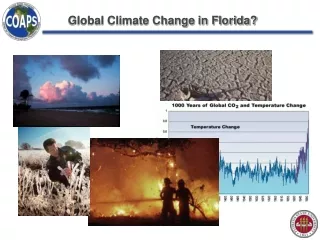
Annual Inflows to Perth Reservoirs, 1911-1998 CSIRO and Bureau of Met were asked: Is this human-induced Climate Change? Or is it climate variability?
(Still to come from Aspendale) 3x3 panels, showing rainfall trends over Australia, from 9 climate models with Greenhouse gaes included. 7 of 9 showed a maximum drying trend in SWWA. However, all of them showed a drying rate much slower than the observed one. CSIRO and BoM concluded that --while it was NOT certain -- Greenhouse was probably the main cause.
Is this global, and if so why? How widespread is this kind of drying? Is it due to rainfall? Or to temperature rise? Or to increasing winds?
Increases Decreases Land precipitation is changing significantly over broad areas Smoothed annual anomalies for precipitation (%) over land from 1900 to 2005; other regions are dominated by variability.
Drought is increasing most places The most important spatial pattern (top) of the monthly Palmer Drought Severity Index (PDSI) for 1900 to 2002. The time series (below) accounts for most of the trend in PDSI. Rainfall -- and temperature
1979-2003 1951-1978 1901-1950 Warm nights are increasing; cold nights decreasing fewer more fewer more 10th (left) and 90th (right) percentiles Frequency of occurrence of cold or warm temperatures for 202 global stations with at least 80% complete data between 1901 and 2003 for 3 time periods: 1901 to 1950 (black), 1951 to 1978 (blue) and 1979 to 2003 (red).
Sea level is rising in 20th century • Rates of sea level rise: • 1.8 + 0.5 mm yr-1, 1961-2003 • 1.7 + 0.5 mm yr-1, 20th Century • 3.1 + 0.7 mm yr-1, 1993-2003 SPM-3b (still mostly from “thermal expansion”, but ice loss is growing)
Glacier contribution to sea-level since 1961 Increased glacier retreat since the early nineties • Mass loss from glaciers and ice caps: • 0.5 ± 0.18 mm yr-1, 1961-2003 • 0.77 ± 0.22 mm yr-1, 1991-2003
Ice sheet contributions to sea level rise • Mass loss of Greenland: • 0.05 ± 0.12 mm yr-1 SLE, 1961-2003 • 0.21 ± 0.07 mm yr-1 SLE, 1991-2003 • Mass loss of Antarctica: • 0.14 ± 0.41 mm yr-1 SLE, 1961-2003 • 0.21 ± 0.35 mm yr-1 SLE, 1991-2003 Antarctic ice sheet loses mass mostly through increased glacier flow Greenland mass loss is increasing Loss: glacier discharge, melting
How well do climate models simulate such trends? Coupled climate models do well at forecasting temperature, and fairly well at predicting winds -- but they do not do well at predicting rainfall. Experience suggests that the average of climates simulated by many models is more “skilful” than any single model forecast. In the following, observed temperatures are compared to the average of (16 +23?? -- see Bindoff’s slide 29) simulations.
Observations Attribution • are observed changes consistent with expected responses to forcings • inconsistent with alternative explanations All forcing Solar+volcanic TS-23
Observations • Anthropogenic greenhouse gas increases very likely caused most of the observed warming since mid-20th century All forcing Solar+volcanic TS-23
Continental warming SPM-4 likely shows a significant anthropogenic contribution over the past 50 years Observations All forcing natural forcing
IF EUROPE CAN DO THIS, WHY CAN’T WE? (www. trecers. net)