Download
1 / 31
310 likes | 504 Views
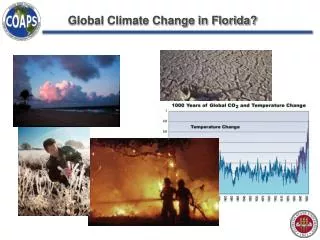
Global Climate Change in Florida?. Global Climate Change in Florida. By Dr. James J. O’Brien Retired Emeritus Robert O. Lawton Distinguished Professor Meteorology and Oceanography. AASC 2007. THE ORANGE STORY THE SEALEVEL STORY THE TEMPERATURES THE HURRICANES. THE FLORIDA ORANGE STORY.

E N D
Global Climate Change in Florida By Dr. James J. O’Brien Retired Emeritus Robert O. Lawton Distinguished Professor Meteorology and Oceanography
AASC 2007 • THE ORANGE STORY • THE SEALEVEL STORY • THE TEMPERATURES • THE HURRICANES
HISTORY OF ORANGE FREEZES Major Impact Freezes Feb 1835: Mentions of orange groves in St. Augustine, FL, Northern Florida, Southern Georgia and parts of coastal South Carolina. The freeze destroyed all groves north of 28˚N- eliminated groves entirely from Georgia and South Carolina. Dec 1894/Feb 1895: Groves in Jacksonville, Palatka, Deland, and Fort George complete destroyed. Most growers that had groves north of Ocala relocated to Hillsborough, Manatee and Polk counties- though some still stayed north. Mentions of groves in the following counties: Alachua, Pinellas, Hillsborough, Lake, Seminole, Orange, Sumter, DeSoto, Lee, Indian River, and Manatee Dec 1962: Heavy damage north and west of a line from Volusia across to Manatee, Hardee and DeSoto. Mentions of groves in the following counties: Marion, Putnam, Volusia, Pasco, Hernando, Lake, Citrus, Sumter, Orange, Osceola, Seminole, Hillsborough, Polk, Pinellas, Manatee, Sarasota, Brevard, Hardee, DeSoto, Highlands, Lee, Hendry, Charlotte, Indian River, St. Lucie, Martin, Palm Beach, Broward Dec 1983: Heavy damage reported in Alachua, Citrus, Flagler, Hernando, Lake, Marion, Orange, Pasco, Putnam, St. Johns, Seminole, Sumter, Volusia Extensive damage reported in Northern Hillsborough, N. Osceola, N. Polk Moderate damage reported in Hillsborough, Pinellas, Polk, Brevard Minimal damage reported in Charlotte, Collier, DeSoto, Glades, Hardee, Henry, Highlands, Indian River, Lee, Martin, Okeechobee, Palm Beach, St. Lucie, Sarasota.
HISTORY OF ORANGE FREEZES Dec 1983: Heavy damage reported in Alachua, Citrus, Flagler, Hernando, Lake, Marion, Orange, Pasco, Putnam, St. Johns, Seminole, Sumter, Volusia Extensive damage reported in Northern Hillsborough, N. Osceola, N. Polk Moderate damage reported in Hillsborough, Pinellas, Polk, Brevard Minimal damage reported in Charlotte, Collier, DeSoto, Glades, Hardee, Henry, Highlands, Indian River, Lee, Martin, Okeechobee, Palm Beach, St. Lucie, Sarasota. Jan 1985: Light damage reported south of a line from Manatee to Indian River. Heavy damage in Citrus, Hernando, Marion, Sumter, Volusia, Lake, N. Orange, N. Seminole, Pasco, N. Polk, N. Osceola, Brevard. Other counties mentioned has having groves: Highlands, Hillsborough, Hardee, DeSoto, Manatee, Sarasota, Indian River, St. Lucie, Martin, Okeechobee, Glades, Hendry, Lee Dec 1989: By this freeze, Alachua and Putnam Counties were removed from the survey due to the lack of orange groves. This freeze also pushed the following counties to be removed/or nearly removed from the survey: Marion, Hernando, Citrus, Sumter, Volusia. Most mature trees were killed in Lake, Orange Sumter and Volusia counties. Severe damage reported in Polk County. Other counties surveyed: Pasco, Hillsborough, Osceola, Hardee, DeSoto, Brevard, Highlands, Indian River, St. Lucie, Martin, Palm Beach, Okeechobee, Charlotte, Collier, Glades, Hendry, Lee
Local sea level measurements Key West 2.27 mm/yr Pensacola 2.14 mm/yr
Historic sea level rise • Sea level measurements from 23 highest quality tidal stations around the world. • Estimates of sea level rise from 1 mm/yr to 2 mm/yr. • Satellite measurements (altimeters) since 1992 indicate a rise of around 3mm/yr. • IPCC third assessment report stated "No significant acceleration in the rate of sea level rise during the 20th century has been detected."
What if sea level rose 6 meters? Image courtesy of Environmental Studies Laboratory, University of Arizona
Sea Level Rise • Global Measurements from Tide Gauges: 2.1 mm/year = 8.4 in/century • Global Measurement from Altimeter: 3.1 mm/year = 12.4 in/century • There is no acceleration observed • Al Gore says 20 feet sometime • At current rate, 5 feet will take 484 years • At double current rate, 5 feet in 242 years • At quadruple rate, 5 feet in 141 years • The pertinent question for Florida is not will sea level rise but will storms get stronger
THE FLORIDA TEMPERATURE STORY MOST RURAL STATIONS ARE COOLING 2-4 F/CENTURY
A Closer Look – De Funiak Springs • Town is located to the northeast of Eglin AFB, a large expanse of undeveloped forests. • Surrounding countryside consists of pastures, farmland, and pine forests. • Station located at Showel Farms, 3 miles to the east of the city. • Walton County population is very low at around 40,000. • USHCN station (unadjusted data)
A Closer Look – Arcadia • Small Town surrounded by pastures, citrus groves, pine stands, and lowlands. • Station located at the water treatment plant inside the city limits. • Arcadia has grown very little in the last 40 years and only has a population of around 10,000. • USHCN station (unadjusted data)
A Closer Look – Fort Myers • Station located at Page Field near downtown Fort Myers. • The city of Fort Myers has experienced tremendous urban sprawl in the last 40 years. • Lee county population has ballooned from 60,000 to over a half million in the last 40 years. • USHCN station (unadjusted data)
A Closer Look – Belle Glade • Small Farming community near the southern shore of Lake Okeechobee. • Station located 2.5 miles south of town at the Agriculture Experiment Station. • Relatively stable population. • USHCN station (unadjusted data) • Data record SHOULD be reflective of predominant climate trends.
Wrong!!! – Land Use Change Land cover maps of Florida from the pre-1900’s and from 1993 show the area south of Okeechobee now surrounded by irrigated sugar cane fields. Mesoscale modeling has shown large summertime temperature differences in the area from differences in land use (Marshall, et al., 2004). Temperature difference in degrees C
25-Year Period Signal + Trend 2-Year Period Signal + Trend Smoothed Time Series
2-Year Period + 25-Year Period Signals + Trend Smoothed Time Series
THE END QUESTIONS PLEASE