RCUC The Dispatch Process
Introduction. Scheduling versus DispatchImmediate PrioritiesMedium Term Priorities and Inputs into the decision to Reschedule or RedispatchWhy Dispatch and Schedule may differLoad Rise and Night Valley. Scheduling and Dispatch. The output of the scheduling process is:A Unit Commitment scheduleA set of discrete MW set points for each unit at 30 minute intervalsA reserve schedule for each jurisdictionA tie-line flow scheduleThe dispatch process:Adheres to Operational Priorities (safety,288

RCUC The Dispatch Process
E N D
Presentation Transcript
1. RCUC & The Dispatch Process Donal Connolly (Eirgrid)
Michael Preston (SONI)
2. Dispatch is the process of giving effect to the schedule within the system conditions prevailing at the time.
Immediate priorities for system operation.
Medium term priorities, looking at the next critical point either a load peak or valley.
Both immediate and medium term priorities will influence and provide inputs in to the decision to reschedule or re-dispatch.
Look at some reasons why the dispatch might differ from the schedule.
Mention two critical points in any day for system operation that is the peak or peaks of the day and the night valley.Dispatch is the process of giving effect to the schedule within the system conditions prevailing at the time.
Immediate priorities for system operation.
Medium term priorities, looking at the next critical point either a load peak or valley.
Both immediate and medium term priorities will influence and provide inputs in to the decision to reschedule or re-dispatch.
Look at some reasons why the dispatch might differ from the schedule.
Mention two critical points in any day for system operation that is the peak or peaks of the day and the night valley.
3. Scheduling and Dispatch The output of the scheduling process is:
A Unit Commitment schedule
A set of discrete MW set points for each unit at 30 minute intervals
A reserve schedule for each jurisdiction
A tie-line flow schedule
The dispatch process:
Adheres to Operational Priorities (safety, security, economy)
Aims to match demand with generation on a second by second basis
Maintains tie-line flow schedules
Maintains adequate levels of operating reserve at all times
Plans for credible generation and transmission contingencies
Manages real time system disturbances that cause frequency deviations, transmission overloads or voltage problems
The Control room operators use the output of the scheduling process to guide them in the dispatch process
The units that should be on load, units that should be started and units to be de-committed and the associated times.
A MW output for each unit at 30 minute intervals through out the trading day.
A reserve schedule for each jurisdiction.
And a tie line flow schedule for each trading period.
The dispatch process must adhere to the operational priorities of Safety of People, Safety of Plant, System Security and Economic and Efficient operation of the power system, in that order.
Matches Generation with System Demand on a second by second basis, Keeping the system frequency at 50Hz. Target frequency range of 50.1 to 49.9Hz.
Maintains the flow on the tie line to the values specified in the schedule.
Maintains adequate levels of reserve on the system at all times.
Plans for credible generation and transmission contingencies, the loss of the largest in-feed and the tripping of key lines or cables.
Manages real time system disturbances that cause frequency deviations, transmission overloads or voltage problems. Does not have to be a disturbance could be changes in the generation pattern e.g. Prospect � Tarbert 220kV line.
Control room operators will use the output of the scheduling process to guid them in the dispatch process.The units that should be on load, units that should be started and units to be de-committed and the associated times.
A MW output for each unit at 30 minute intervals through out the trading day.
A reserve schedule for each jurisdiction.
And a tie line flow schedule for each trading period.
The dispatch process must adhere to the operational priorities of Safety of People, Safety of Plant, System Security and Economic and Efficient operation of the power system, in that order.
Matches Generation with System Demand on a second by second basis, Keeping the system frequency at 50Hz. Target frequency range of 50.1 to 49.9Hz.
Maintains the flow on the tie line to the values specified in the schedule.
Maintains adequate levels of reserve on the system at all times.
Plans for credible generation and transmission contingencies, the loss of the largest in-feed and the tripping of key lines or cables.
Manages real time system disturbances that cause frequency deviations, transmission overloads or voltage problems. Does not have to be a disturbance could be changes in the generation pattern e.g. Prospect � Tarbert 220kV line.
Control room operators will use the output of the scheduling process to guid them in the dispatch process.
4. Operating the System When assessing whether the current schedule is adequate to feed into the dispatch process the Operator will give consideration to:
Immediate Priorities
Frequency, Voltage and Flows on Line within limits
Reserve check
Tie Line Flow (actual to RCUC schedule)
Medium Term Priorities
Load comparison (actual to latest forecast to RCUC schedule)
Wind comparison (actual to latest forecast to RCUC schedule)
Generator Availability Changes
Tie Line Flow
Margin Check
If the schedule is not adequate the Operator will prepare a new schedule
This slide looks at Immediate and medium term priorities for operating the electricity system. Medium term looks at the next peak or valley.
Immediate Priorities
The very first action on taking control of the system is to ensure system frequency, voltage and the power flows on the lines and cables are within limits. If not immediate action is taken to return within limits.
A check on reserve, at this moment is there enough reserve to meet the loss of the largest in-feed.
Is the flow on the tie line correct, does it agree with the scheduled flow.
Medium term priorities
Comparing the current system load with the latest load forecast and the most recent RCUC schedule.
Looking at the current wind output and comparing it to the latest wind forecast and the most recent RCUC schedule.
Checking to see if there has been any availability changes since the last schedule.
Looking at what is scheduled to flow on the tie line at the peak.
Then a margin check. Looking at the next peak and seeing how many MWs over and above the peak demand we have available to us from plant already synchronised and plant that can be started quickly.This slide looks at Immediate and medium term priorities for operating the electricity system. Medium term looks at the next peak or valley.
Immediate Priorities
The very first action on taking control of the system is to ensure system frequency, voltage and the power flows on the lines and cables are within limits. If not immediate action is taken to return within limits.
A check on reserve, at this moment is there enough reserve to meet the loss of the largest in-feed.
Is the flow on the tie line correct, does it agree with the scheduled flow.
Medium term priorities
Comparing the current system load with the latest load forecast and the most recent RCUC schedule.
Looking at the current wind output and comparing it to the latest wind forecast and the most recent RCUC schedule.
Checking to see if there has been any availability changes since the last schedule.
Looking at what is scheduled to flow on the tie line at the peak.
Then a margin check. Looking at the next peak and seeing how many MWs over and above the peak demand we have available to us from plant already synchronised and plant that can be started quickly.
5. Load Comparison The next two slides look at load forecast and wind output forecast. If you can accurately predict the load and the wind output, scheduling and dispatch become much easier and the differences between them are minimised.
This slide shows four load curves April, winter, summer and a summer bank holiday.
As you can see the load shape varies depending on the time of year. The curves also vary depending on the day of the week, weather conditions and social events.
We are checking to see what is coming next from a load point of view.
And then looking at the current load ensuring that there is a good load comparison with which to forecast the load for the remainder of the day for the prevailing weather conditions of the day.The next two slides look at load forecast and wind output forecast. If you can accurately predict the load and the wind output, scheduling and dispatch become much easier and the differences between them are minimised.
This slide shows four load curves April, winter, summer and a summer bank holiday.
As you can see the load shape varies depending on the time of year. The curves also vary depending on the day of the week, weather conditions and social events.
We are checking to see what is coming next from a load point of view.
And then looking at the current load ensuring that there is a good load comparison with which to forecast the load for the remainder of the day for the prevailing weather conditions of the day.
6. Wind Comparison This slide shows the output of our wind forecaster.
We have two wind forecasts, WEPROG and a combined MORECARE and WEPROG.
We are firstly comparing the two forecasts to see if they generally agree with each other.
Then how does the actual wind output at present compare with the forecast.
Using this information to try and determine what the wind output will be over the remainder of the trading day and particularly at the peak and valley.This slide shows the output of our wind forecaster.
We have two wind forecasts, WEPROG and a combined MORECARE and WEPROG.
We are firstly comparing the two forecasts to see if they generally agree with each other.
Then how does the actual wind output at present compare with the forecast.
Using this information to try and determine what the wind output will be over the remainder of the trading day and particularly at the peak and valley.
7. Tie Line Schedule The Tie line flow schedule is imported into the energy management system and this slide is a screen shot of how it is presented to the operator.
It is more usual for the operator to monitor the actual flow on the tie line and use the area control error to indicate deviation from the schedule.
The area control error looks at the actual flow on the tie line, compares this to the scheduled flow and taking the frequency into account indicates the deviation and the jurisdiction responsible.
We are particularly interested in what is scheduled to flow on the tie line at the next peak and whether both system operators are comfortable with this value.The Tie line flow schedule is imported into the energy management system and this slide is a screen shot of how it is presented to the operator.
It is more usual for the operator to monitor the actual flow on the tie line and use the area control error to indicate deviation from the schedule.
The area control error looks at the actual flow on the tie line, compares this to the scheduled flow and taking the frequency into account indicates the deviation and the jurisdiction responsible.
We are particularly interested in what is scheduled to flow on the tie line at the next peak and whether both system operators are comfortable with this value.
8. Margin Check MW
MWs Available 4673
Short Available 4464
To/From SONI 311
Wind 114
4889
Est. Peak 4000
Margin 889
Reserve
POR 308 MW (75% of largest in feed, 5 � 15 sec)
SOR 308 MW (75% of largest in feed, 15 � 90 sec)
TOR1 410 MW (100% of largest in feed, 90 sec � 5 min)
TOR2 410 MW (100% of largest in feed, 5 min � 20 min) With the margin check we are looking at the next peak and as mentioned earlier seeing how many MWs in excess of the peak we have available from plant already synchronised and plant that can be started quickly.
Take the total MWs available and from this remove any sets that cannot be on load in 30 minutes to get the short available MW value.
To this figure add or subtract the tie line flow at the peak. In this case it is added as its 311 MWs from north to south.
Add the wind forecast, this figure may be adjusted up or down depending on the confidence in the forecast.
The total of these three figures gives the MWs available at short notice at the peak of the day.
So subtracting the estimated peak gives the margin and comparing this figure to the largest in feed gives an indication of the tightness or otherwise of the system.
This margin figure is slightly conservative as it only looks at Eirgrid�s jurisdiction.With the margin check we are looking at the next peak and as mentioned earlier seeing how many MWs in excess of the peak we have available from plant already synchronised and plant that can be started quickly.
Take the total MWs available and from this remove any sets that cannot be on load in 30 minutes to get the short available MW value.
To this figure add or subtract the tie line flow at the peak. In this case it is added as its 311 MWs from north to south.
Add the wind forecast, this figure may be adjusted up or down depending on the confidence in the forecast.
The total of these three figures gives the MWs available at short notice at the peak of the day.
So subtracting the estimated peak gives the margin and comparing this figure to the largest in feed gives an indication of the tightness or otherwise of the system.
This margin figure is slightly conservative as it only looks at Eirgrid�s jurisdiction.
9. Reschedule or Dispatch Having built up an accurate picture of the power system and reached conclusions as to how demand, wind or availability may change and taking transmission contingencies into account, a judgement is made as to whether there will be a significant or small departure from the current schedule.
If is felt that there will be a significant deviation a new schedule will be jointly prepared by the system operators.
If only a small deviation is envisaged both system operators use a merit order of units under their control
To manage real time fluctuations in their control area
Maintain the required levels of reserve
Maintain tie line flow
The merit order is based on the bids and offers submitted by the participants for that trading day.Having built up an accurate picture of the power system and reached conclusions as to how demand, wind or availability may change and taking transmission contingencies into account, a judgement is made as to whether there will be a significant or small departure from the current schedule.
If is felt that there will be a significant deviation a new schedule will be jointly prepared by the system operators.
If only a small deviation is envisaged both system operators use a merit order of units under their control
To manage real time fluctuations in their control area
Maintain the required levels of reserve
Maintain tie line flow
The merit order is based on the bids and offers submitted by the participants for that trading day.
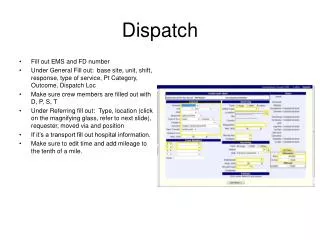
10. RCUC to EDIL This slide looks at the sequence from RCUC output to dispatch instructions to the generators.
If a new schedule is required a RCUC run is started. This process takes approx. 40 minutes and a detailed procedure is followed.
The output as mentioned earlier is the schedule, unit outputs, reserve schedule and tie line flow schedule.
This information is transferred to a spreadsheet and is used to guide the operator in issuing dispatch instructions to the generators.
If a new schedule is not required small adjustments are made to the existing schedule in the spreadsheet and this then guides the operator in issuing instructions.
The spreadsheet is used
As it allows the information to be seen more easily
It is easier to make small changes
It produces the gas indicative schedule in Eirgrids jurisdiction.This slide looks at the sequence from RCUC output to dispatch instructions to the generators.
If a new schedule is required a RCUC run is started. This process takes approx. 40 minutes and a detailed procedure is followed.
The output as mentioned earlier is the schedule, unit outputs, reserve schedule and tie line flow schedule.
This information is transferred to a spreadsheet and is used to guide the operator in issuing dispatch instructions to the generators.
If a new schedule is not required small adjustments are made to the existing schedule in the spreadsheet and this then guides the operator in issuing instructions.
The spreadsheet is used
As it allows the information to be seen more easily
It is easier to make small changes
It produces the gas indicative schedule in Eirgrids jurisdiction.
11. Unit Trip I mentioned looking at some reasons that dispatch differs from the schedule.
A change in unit availability is one reason and probably the most dramatic is a unit trip.
This slide shows the frequency and tie line flow following a 400MW unit trip in SONI�s jurisdiction.
The frequency prior to the event was 49.94 Hz and the flow on the tie line was 207MW north to south.
After the event the frequency fell to 49.29Hz and the tie line flow reversed to a 78MW flow south to north. This is the shared reserve.
The interruptible customers in Eirgrids jurisdiction trip at 49.3Hz.I mentioned looking at some reasons that dispatch differs from the schedule.
A change in unit availability is one reason and probably the most dramatic is a unit trip.
This slide shows the frequency and tie line flow following a 400MW unit trip in SONI�s jurisdiction.
The frequency prior to the event was 49.94 Hz and the flow on the tie line was 207MW north to south.
After the event the frequency fell to 49.29Hz and the tie line flow reversed to a 78MW flow south to north. This is the shared reserve.
The interruptible customers in Eirgrids jurisdiction trip at 49.3Hz.
12. Dispatch Instructions (Unit Trip) This slide shows the Eirgrid dispatch instructions in response to the trip.
These instructions are issued rapidly in this case over about a minute and a half, so quick decisions have to be made.
Once the frequency has recovered the next priority is recovering the reserve.
It is worth bearing in mind that some of these units are energy limited and as such may have limited time at high loads.
The decision whether to rerun RCUC to provide a new schedule will be influenced by the information from the tripped generator if it will be back shortly it may not be necessary to rerun the unit commitment package.This slide shows the Eirgrid dispatch instructions in response to the trip.
These instructions are issued rapidly in this case over about a minute and a half, so quick decisions have to be made.
Once the frequency has recovered the next priority is recovering the reserve.
It is worth bearing in mind that some of these units are energy limited and as such may have limited time at high loads.
The decision whether to rerun RCUC to provide a new schedule will be influenced by the information from the tripped generator if it will be back shortly it may not be necessary to rerun the unit commitment package.
13. Frequency Response This slide shows the initial response of all the sets in the Eirgrid jurisdiction to the trip.
The negative MWs are used to show tie line flow north to south.This slide shows the initial response of all the sets in the Eirgrid jurisdiction to the trip.
The negative MWs are used to show tie line flow north to south.
14. Load Comparison Differences between actual load and the load forecast also lead to differences between dispatch and schedule.
This slide shows three load curves and the inset chart shows the temperature for each day. The current day in red, previous day in bleu & previous week in green.
Just to mention some of the differences. The previous day was a Monday so typically the valley on a Monday is lower than the other days of the week. The temperature was lower the previous week which usually leads to higher load.
During the morning the next critical points are the 18:00 peak and the lighting up peak. Looking at the current position lower than the previous day or the previous week one would be predicting that the 18:00 peak would not be higher than the previous day or week.
A cold front crossed the country at 15:00 it was in a line from Mayo to Waterford moving east, reaching Dublin before 18:00.
Then probably thinking that the lighting up peak would be as high as the previous day or week. But the first leg of Liverpool v Chelsea was on.
It can be very difficult to accurately predict load behaviour as it can be heavily influenced by weather and social events.Differences between actual load and the load forecast also lead to differences between dispatch and schedule.
This slide shows three load curves and the inset chart shows the temperature for each day. The current day in red, previous day in bleu & previous week in green.
Just to mention some of the differences. The previous day was a Monday so typically the valley on a Monday is lower than the other days of the week. The temperature was lower the previous week which usually leads to higher load.
During the morning the next critical points are the 18:00 peak and the lighting up peak. Looking at the current position lower than the previous day or the previous week one would be predicting that the 18:00 peak would not be higher than the previous day or week.
A cold front crossed the country at 15:00 it was in a line from Mayo to Waterford moving east, reaching Dublin before 18:00.
Then probably thinking that the lighting up peak would be as high as the previous day or week. But the first leg of Liverpool v Chelsea was on.
It can be very difficult to accurately predict load behaviour as it can be heavily influenced by weather and social events.
15. Wind Forecast Another area that can cause differences between dispatch and schedule is differences between actual wind output and the forecast wind output.
It is great to have two wind forecasts for comparison but it can lead to uncertainty if the two forecasts diverge.
Wind forecast diverging from actual wind also leads to difficulties predicting the actual wind output over the remainder of the day.
Timing is also a factor. Large increases or decreases in wind output over a short period of time can lead to significant differences between dispatch and schedule if it is a few hours early or late.Another area that can cause differences between dispatch and schedule is differences between actual wind output and the forecast wind output.
It is great to have two wind forecasts for comparison but it can lead to uncertainty if the two forecasts diverge.
Wind forecast diverging from actual wind also leads to difficulties predicting the actual wind output over the remainder of the day.
Timing is also a factor. Large increases or decreases in wind output over a short period of time can lead to significant differences between dispatch and schedule if it is a few hours early or late.
16. Met Information For additional information we tend to look at Met information.
We have found that pressure charts can provide useful information, particularly on timing.For additional information we tend to look at Met information.
We have found that pressure charts can provide useful information, particularly on timing.
17. Wind Rising This slide shows the system load in pink and the wind output in blue.
I included this slide to indicate the importance of having accurate wind forecasts.
At midday you know that there will be an additional 400MWs of load at the evening peak. The wind forecast is predicting and additional 400MWs of wind output by this time.
If the wind does not pick up by 400MWs some of the additional plant required to meet the peak could be 5 � 6 hours away, so a decision would have to be made at 13:00.This slide shows the system load in pink and the wind output in blue.
I included this slide to indicate the importance of having accurate wind forecasts.
At midday you know that there will be an additional 400MWs of load at the evening peak. The wind forecast is predicting and additional 400MWs of wind output by this time.
If the wind does not pick up by 400MWs some of the additional plant required to meet the peak could be 5 � 6 hours away, so a decision would have to be made at 13:00.
18. Contingency Analysis
19. Load Rise 07 Apr 08 RCUC looks at 30 minute intervals but demand is changing on a second by second basis and the dispatcher must consider how the demand changes when issuing instructions
20. Dispatch Instructions 07 Apr 08 As can be seen here, to manage a typical morning load rise the operator had to issue 55 separate MW instructions over a 2 and � hour period.
21. Night Valley 06 May 07 This table shows the problems faced by the operator when all plant is dispatched to Minimum Load.
The operator may have to de-commit plant in an unscheduled way due to unexpected increases in wind output, decreases in system demand, generator limitations or a combination of all of these.
22. Summary The Scheduling Process feeds into the Dispatch Process
Operators take a number of real-time factors into account when issuing dispatch instructions
Time permitting, Operators will re-schedule if the current schedule cannot be followed
Operators will face unplanned issues when dispatching
At all times operators give priority to safety and security