Measuring Speed and Velocity through Walks: Data Collection and Graphing Activity
In this engaging classroom activity, students will learn about measuring speed and velocity using 20 feet of measuring tape. Volunteers will walk along the tape while following specific directions timed by a partner. Students will also practice recording their positions at intervals, creating a T-chart to organize their data. This hands-on experience culminates in graphing exercises, helping students visualize relationships between time and distance. They will analyze how variations in speed and direction impact their graphs, enhancing their understanding of motion concepts.

Measuring Speed and Velocity through Walks: Data Collection and Graphing Activity
E N D
Presentation Transcript
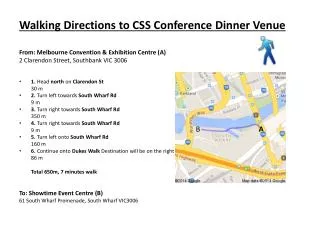
Walking Directions
We are going to learn about measuring speed and velocity and creating graphs to represent them.
First, we have 20 feet of measuring tape marked off in our classroom. We will need a volunteer to follow these directions and walk along the tape in 10 seconds: Start at the 4 foot mark. Stand still for 4 seconds, then walk at a constant rate until the time keeper calls the 8th second. Then, turn and walk back toward the beginning quickly until time runs out.
Now, let’s add in another part – while the timekeeper times you, I will call out, a multiple of two every two seconds. When I call out, each multiple of two, a member of your team will lay down a card that marks the spot where you are along the tape measure. Let’s practice again, this time with someone marking your location every two seconds. - Start at the 4 foot mark. Stand still for 4 seconds, then walk at a slow, but constant rate until the time keeper calls the 8th second. Then, turn and walk back toward the beginning quickly until time runs out.
Let’s practice the whole thing again. This time, a student will be the timekeeper and will call out, a multiple of two every two seconds. A second student will lay the cards down at the walker’s location each time the timekeeper calls out a multiple of two and the walker will follow the same directions – Start at the 4 foot mark. Stand still for 4 seconds, then walk at a slow, but constant rate until the time keeper calls the 8th second. Then, turn and walk back toward the beginning quickly until time runs out. http://www.youtube.com/watch?v=PB30YltSBkg http://www.online-stopwatch.com/
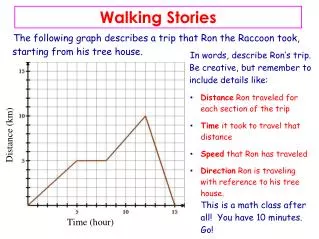
Let’s graph this group’s results: y 19 18 17 16 15 14 13 12 11 Distance 9 8 7 6 5 4 3 2 x 2 3 4 5 6 7 8 9 11 12 13 14 15 16 17 18 19 Time
Yesterday, you worked with groups to collect your data. Today, you will work with your groups to create graphs of your data. Use the t-charts in your science notebooks as your data to create ordered pairs. Remember: (time= x, distance= y) (x) (y) (0,___) (2,___) (4,___) (6,___) (8,___) (10,___)
Are you ready to try it in groups of your own? • You will get: • 20 feet of measuring tape • a stopwatch • cards marked “2 seconds, 4 seconds, 6 seconds, all the way to 10 seconds • 2 pieces of chart paper • a piece of chart graph paper • markers and other writing materials • science notebooks • walking directions • a piece of construction paper
You will: • Have three people in your group – a timekeeper, a marker and a walker. • You will practice, just like we did with the sample group, walking according to the instructions while the timekeeper calls multiples of 2, and the marker places the cards in the correct locations each time. • Practice several times until you and your group have it down.
When you and your group have practiced and can do it correctly: • Create a mini t-chart in your science notebook to record your data.
Now! You are ready to create your presentation! Copy your walking directions onto your chart paper. Create a t-chart on your chart paper. (It will be just like the one in your science notebook). Create a list of your ordered pairs on the construction paper. (time/x, distance/y) Create a graph on the large chart paper. Plot all your ordered pairs. Post your graph on one wall of the classroom. Post your ordered pairs and walking directions on another wall. We’re going to try to match everything back up – directions to graphs!
What do you notice about graphs and speed/direction? What does the line plot look like when the speed is constant? What does the line look like when the speed changes? What does the line look like when the direction changes? What is the vocabulary word that describes BOTH speed AND direction?
http://www.youtube.com/watch?v=1Mh5VEC_04U http://www.youtube.com/watch?v=aohdxsKzy9w