WT control
Figure S1. WT control. A3R KO control. WT-TAC. A3R KO-TAC. Cell size. Fibrosis.

WT control
E N D
Presentation Transcript
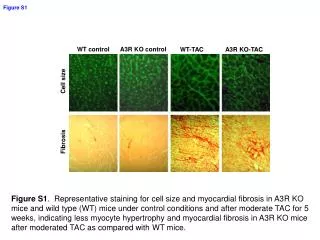
Figure S1 WT control A3R KO control WT-TAC A3R KO-TAC Cell size Fibrosis Figure S1. Representative staining for cell size and myocardial fibrosis in A3R KO mice and wild type (WT) mice under control conditions and after moderate TAC for 5 weeks, indicating less myocyte hypertrophy and myocardial fibrosis in A3R KO mice after moderated TAC as compared with WT mice.
Figure S2. The TAC induced mortality was not different between A3R KO and Wild type mice (Wt) mice.
A B C n=18 n=15 n=10 n=18 n=10 n=11 n=11 n=15 n=18 n=15 n=10 n=11 Figure S3. A1R KO had no effect on the increase of ventricular mass (A) or the ratio of ventricular mass to body weight 2 days after severe TAC. *P<0.05 compared to the corresponding control.
p<0.05 Figure S4. A1R KO significantly increased mortality in mice subjected to severe TAC for 4 weeks. A: severe TAC-induced survival rate in WT and A1R KO mice.
Survived a Heart rate (beats/min) b c Surgery Hours c Heart rate (beats/min) a b Surgery died Hours Figure S5: ECG telemetry shows progressive bradycardia in WT and A1R KO mice (C) after severe TAC.
A WT control CD73 KO control WT TAC-4W CD73 KO TAC-4W B C D E n=11 n=11 n=8 n=8 n=11 n=11 n=11 n=11 n=11 n=11 n=8 n=8 n=8 n=8 n=8 n=8 Figure S6. CD73 KO significantly exacerbated the decrease of LV ejection fraction (A), increase of LV end systolic diameter (B), and increase of LV end diastolic diameter (C) produced by 4 weeks of moderate TAC. CD73 KO had no significant effect on heart rate under either control conditions or after moderate TAC (D).
B C D E Wild type Control Wild type TAC-4W CD73 KO Control CD73 KO TAC - 4W A ANF β-MHC TNF 3-NT Figure S7. CD73 KO significantly exacerbates the TAC-induced increase of ventricular ANP, TNF and nitrotyrosine. TAC caused significant increases of ventricular myosin heavy chain (MHC) in both CD73 KO and wild type mice. CD73 KO tended to increase ventricular MHC after TAC, but the difference was not significant. *P<0.05 compared to the corresponding control; #p<0.05 compared to Wt-TAC.
n=12 n=19 n=12 n=12 n=12 n=12 n=19 n=19 n=19 n=19 Figure S8. The stable adenosine analogue CADO attenuated the TAC-induced ventricular hypertrophy as demonstrated by smaller increases of LV mass and ratio of LV mass to body weight. *P<0.05 compared to the vehicle treated group by Student t-test.
Control PE A CADO + MRS1191 CADO + MRS1191 none CADO None CADO P-ERK P-JNK GAPDH * * B C * * * * * Figure S9. Effect of CADO and A3R antagonist MRS1191 on PE-induced increases of p-JNK Thr183/Tyr185 and p-ERKThr202/Tyr204 expression. *P<0.05 between the indicated groups.