Download
1 / 11
130 likes | 285 Views
Explore the utilization of satellite-based precipitation data in US Drought Monitor tools, advancements in monitoring strategies, and the incorporation of remote sensing in drought analysis.

E N D
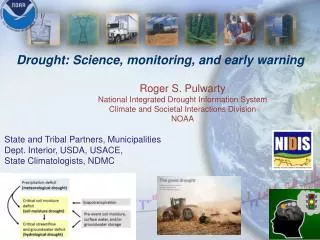
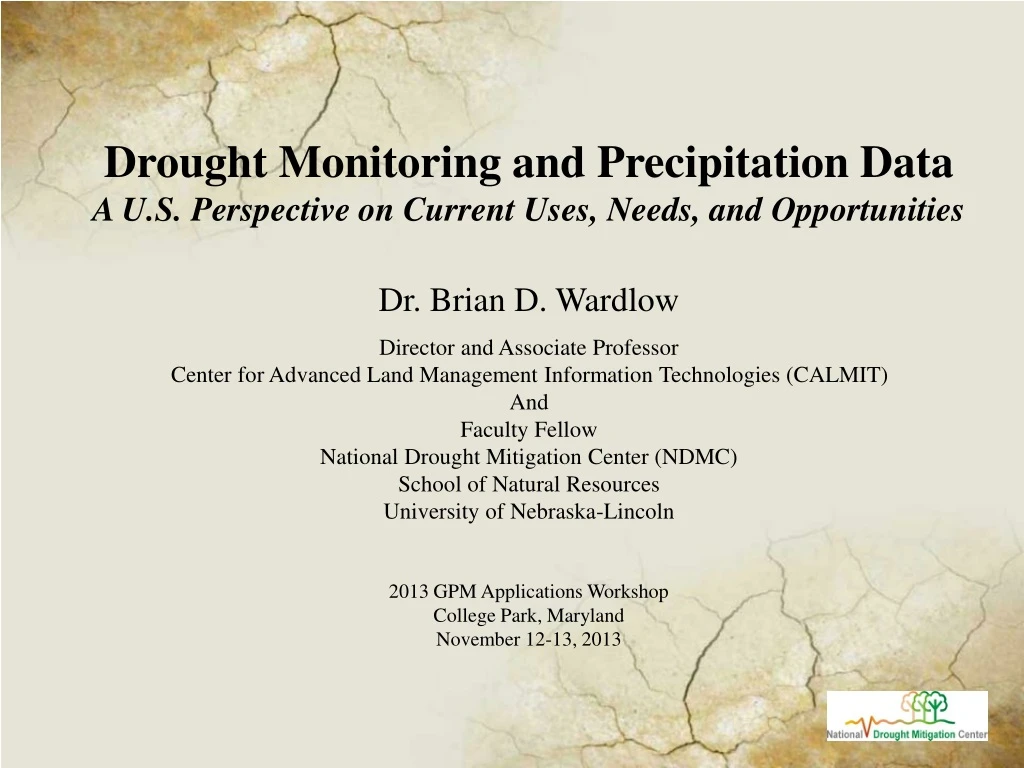
Drought Monitoring and Precipitation Data A U.S. Perspective on Current Uses, Needs, and Opportunities Dr. Brian D. Wardlow Director and Associate Professor Center for Advanced Land Management Information Technologies (CALMIT) And Faculty Fellow National Drought Mitigation Center (NDMC) School of Natural Resources University of Nebraska-Lincoln 2013 GPM Applications Workshop College Park, Maryland November 12-13, 2013
U.S. Drought Monitor (USDM) Current State-of-the-Art Drought Monitoring Tool • Weekly map produced since 1999 by NOAA (CPC, NCDC, WRCC), USDA, and the NDMC. • Composite indicator of both ‘short’ (S) and ‘long’ (L) term drought conditions • Developed through the analysis of many indicators and indices (meteorological, climatological, hydrologic, and ecological) and input from ‘experts’ on the ground. • Widely used for drought-related decision making: • USDA Farm Service Agency (FSA) • Internal Revenue Service (IRS) • Congressional and White House briefings • Media (e.g., major newspapersand television) • Federal and state agencies /organizations Precipitation data are critical input for USDM and other operational U.S. drought monitoring tools, but satellite-based precipitation data are not widely used.
Evolution of the USDM Since the first USDM map in 1999, the geographical depictions and specific classifications of drought (agricultural vs. hydrologic, short- vs. long-term) continue to improve as technology advances and new types of data inputs (including remote sensing) become available.
Examples of Inputs into the USDM • Key Drought Indicators: • - Palmer Drought Index • - SPI • - KBDI • Modeled Soil Moisture • - 7-Day Avg. Stream flow • - Precipitation Anomalies • Growing Season: • - Crop Moisture Index • - Satellite Veg. Health Index • Soil Moisture • Mesonet data • In The West: • - SWSI • - Reservoir levels • Snowpack (SNOTEL) • SWE • Stream flow • Expert Feedback from the Field The USDM has traditionally relied upon station-based precipitation data that are spatially interpolated or aggregated into an anomaly or index product
Examples of Inputs into the USDM • Key Drought Indicators: • - Palmer Drought Index • - SPI • - KBDI • Modeled Soil Moisture • - 7-Day Avg. Stream flow • - Precipitation Anomalies • Growing Season: • - Crop Moisture Index • - Satellite Veg. Health Index • Soil Moisture • Mesonet data • In The West: • - SWSI • - Reservoir levels • Snowpack (SNOTEL) • SWE • Stream flow • Expert Feedback from the Field Until recently, remote sensing products have had limited application in the USDM. • Recent Satellite Remote Sensing Products: • NWS Precipitation Analysis • Vegetation Drought Response Index (VegDRI) • Evaporative Stress Index (ESI) • GRACE Terrestrial Water Storage
Satellite-Based Products for the USDM vegdri.unl.edu/ http://drought.unl.edu/MonitoringTools/NASAGRACEDataAssimilation.aspx vegdri.cr.usgs.gov/viewer/viewer.htm hrsl.arsusda.gov/drought/index.php
NWS Precipitation Analysis Products • The USDM routinely use 4-km precipitation products from the NWS River Forecast Centers (RFCs) produced using a ‘multi-sensor’ approach of precipitation estimates from WSR-88D NEXRAD observations and ground-based gauge measurements. • Daily and 7-day precipitation total – used to identify where and how much rainfall has recently been received. • Precipitation departure or percent of normal – for a long period (e.g., 60- to 90- days for snapshot of longer-term conditions (historical normals used from PRISM data). http://water.weather.gov/precip/
Gridded Standardized Precipitation Index (SPI) Data • Experimental product being considered by the USDM is 4-km gridded SPI data derived from the NWS Precipitation Analysis products and PRISM data produced at Texas A&M University. • SPI – Uses historical precipitation data to calculate probability of precipitation across multiple time scale (e.g., 1 to 12 months). • Routinely used index in USDM and many drought monitoring system globally. • Recognized as universal drought index by World Meteorological Organization (WMO) in 2009. http://atmo.tamu.edu/osc/drought/
Final Thoughts • Why has the use of satellite-based precipitation been lacking in the U.S.? • No definitive answer • - Adequate spatial coverage over most of the U.S. through gauges and NEXRAD estimates (with exception of western part of the U.S.) • - Incorporation of satellite-based remote sensing tools has been • relatively slow (rapid increase in past 5-7years) • Operational needs for the USDM (lessoned learned from the development of recent remote sensing tools) • Near real-time (less than 24 hours from last observation) • Operational product delivery (e.g., every Monday morning) • Anomaly calculations (e.g., percent of normal, percentile, and/or drought index) over longer-historical record (e.g., 30 years) • Customized products (classification color scheme and data format)
Final Thoughts • Opportunities • Internationally, TRMM and GPM precipitation products (particularly anomalies) will be essential for drought monitoring in most regions/countries that often lack dense weather station networks. • USDM process is ‘flexible’ and can be adapted for new data inputs like the precipitation products from TRMM and GPM. • Other tools such as VegDRI, which rely on spatially interpolated precipitation grids from station data, could also benefit from long-term satellite-based precipitation data sets. • Concerns • Long-term data continuity maintain operational products into the future….. Will the product be here tomorrow ?
Thanks for your attention! For questions or further information, please contact: Brian Wardlow bwardlow2@unl.edu or visit the National Drought Mitigation Center (NDMC) website at drought.unl.edu/ Photo courtesy of Tom Pagano