Download
1 / 15
150 likes | 257 Views
Applications of wavelets in PET modelling. - a literature survey. Hammersmith, London Turkheimer et al. 1999-2000. 3 articles of the subject theoretical framework of wavelets image reconstruction and image processing

E N D
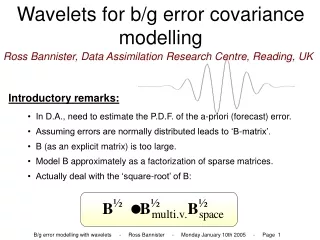
Applications of wavelets in PET modelling - a literature survey
Hammersmith, London Turkheimer et al. 1999-2000 • 3 articles of the subject • theoretical framework of wavelets • image reconstruction and image processing • Dyadic wavelet transform (DWT) and translation invariant DWT (DWT-TI) techniques • applications to dynamic PET-SPECT studies • Parametric images: kinetic and statistical modelling in wavelet space
Denoising images with wavelets • Wavelet transform of dynamic image • Thresholding (e.g. SURE, universal, Bonferroni) • Inverse transform
Studies • Low-resolution SPECT study Hoffman brain phantom DWT vs. DWT-TI in 2D • High-resolution PET images FDG brain study universal thresholding vs. SURE thresholding • Very high-resolution PET images [11C]PK11195 study of peripheral benzodiazepine receptors in the brain high signal-to-noise ratio
Image domain Wavelet domain WT(Dynamic image) Wavelet transform t Kinetic modelling Dynamic image Parametric WT Statistical thresholding Inverse wavelet transform Parametric WT thresholded Parametric image
Studies • Synthetic dynamic study artificial data set with nonstationary noise field • FDG dynamic PET study Patlak plot • [11C]raclopride PET dynamic study D2-receptor distribution in normal brain Logan plot vs. WT
Image domain Wavelet domain WT multiple images Wavelet transform i Statistical modelling Multiple images Parametric WT Wavelet filter Inverse wavelet transform Filtered Parametric WT Filtered parametric map
Studies • Randomization study null dataset with PET H215O activation/rest -> two groups of simulated datasets • Parametric study of cerebral blood flow response to word recognition 5 right-handed normal subjects • Measuring the effect of depression on brain serotonin receptors with [11C]WAY-100635 WT vs. statistical parametric mapping
Karolinska hospital, Stockholm Cselenyi et al. 2002 • Binding potential (BP) study with [11C]FLB 457 • 4 methods traditional ROI analysis (reference data) pixel-based analysis 2 variants of wavelet-aided analyses • Aim is to decrease the noise-sensitivity of a parameter estimation procedure with wavelet approach • 10 healthy male subjects
ROI analysis • BP was estimated using the reference region version of Logan’s graphical analysis (reference region=cerebellar cortex)
Pixel-by-Pixel analysis • radioactivity of a pixel= area under the curve (AUC) of the corresponding TAC • Fitting is done with the same Logan analysis as in ROI-based version • Final product: parametric image of the density of dopamine D2 receptors in brain • Anatomical standardisation • Average BPs were determined in the same ROIs used with ROI-based analysis
Wavelet-based estimation • two-dimensional translation-invariant (2DTI) and three-dimensional (3-DWT) wavelet transform • coefficients of the dynamic WT analysed in the same manner as in pixel-based approach except for the thresholding • Final product: parametric map of BP values • Anatomical standardisation and averaging within ROIs done as in pixel-based analysis
Results Compared to the ROI-based analyses, the BP values were • ~50% with pixel-based analysis (heterogeneous image) • ~78% with 2DTI • ~100% with 3-DWT
References • F. Turkheimer et al.:Multiresolution Analysis of Emission Tomography Images in the Wavelet Domain, J Cereb. Blood Flow Metab. 19:1189-1208 (1999) • F. Turkheimer et al.:Modeling Dynamic PET-SPECT Studies in the Wavelet Domain, J Cereb. Blood Flow Metab. 20:879-893 (2000) • F. Turkheimer et al.:Statistical Modeling of Positron Emission Tomography Images in Wavelet Space, J Cereb. Blood Flow Metab. 20:1610-1618 (2000) • Z. Cselenyi et al.:Wavelet-Aided Parametric Mapping of Cerebral Dopamine D2 Receptors Using the High Affinity PET Radioligand [11C]FLB 457, NeuroImage 17:47-60 (2002)
Other articles • J.-W. Lin et al.:Improving PET-Based Physiological Quantification Through Methods of Wavelet Denoising, IEEE trans. bio. eng. Vol48, No.2 (2001) • P. Millet et al.: Wavelet Analysis of Dynamic PET Data: Applications to the Parametric Imaging of Benzodiazepine Receptor Concentration, NeuroImage 11:458-472 (2000)