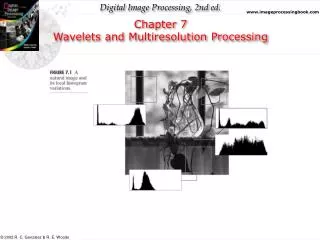
Wavelets ?
Wavelets ?. Raghu Machiraju Contributions: Robert Moorhead, James Fowler, David Thompson, Mississippi State University Ioannis Kakadaris, U of Houston. Simulations, scanners. State-Of-Affairs. Concurrent. Presentation. Retrospective. Analysis. Representation. Why Wavelets?

Wavelets ?
E N D
Presentation Transcript
Wavelets ? Raghu Machiraju Contributions: Robert Moorhead, James Fowler, David Thompson, Mississippi State University Ioannis Kakadaris, U of Houston
Simulations, scanners State-Of-Affairs • Concurrent • Presentation • Retrospective • Analysis • Representation
Why Wavelets? • We are generating and measuring larger datasets every year • We can not store all the data we create (too much, too fast) • We can not look at all the data (too busy, too hard) • We need to develop techniques to store the data in better formats
Data Analysis • Frequency spectrum correctly shows a spike at 10 Hz • Spike not narrow - significant component at between 5 and 15 Hz. • Leakage - discrete data acquisition does not stop at exactly the same phase in the sine wave as it started.
Image Example • 8x8 Blocked Window (Cosine) Transform • Each DCT basis waveform represents a fixed frequency in two orthogonal directions • frequency spacing in each direction is an integer multiple of a base frequency
Windowing & Filtering Windows – fixed in space and frequencies Cannot resolve all features at all instants
Linear Scale Space input s= 1 s= 16 s= 24 s= 32
Sub-sampled Images • Keep 1 of 4 values from 2x2 blocks • This naive approach and introduces aliasing • Sub-samples are bad representatives of area • Little spatial correlation
Image Pyramid – MIP MAP • Average over a 2x2 block • This is a rather straight forward approach • This reduces aliasing and is a better representation • However, this produces 11% expansion in the data
Ideally ! Create new signal G such that ||F-G|| = e
Wavelet Analysis • A1 D1 D2 D3 • D3 • D2 • D1 • A1
Why Wavelets? Because … • We need to develop techniques to analyze data better through noise discrimination • Wavelets can be used to detect features and to compare features • Wavelets can provide compressed representations • Wavelet Theory provides a unified framework for data processing
Scale-Coherent Structures • Coherent structure - frequencies at all scales • Examples - edges, peaks, ridges • Locate extent and assign saliency
Wavelets – Compression Original 50:1
Wavelets – Compression Original 50:1
Yet Another Example 50% 7%
2% Final Example 50% 100% 1%
1.0 0.8 ) E ( n o i t a 0.6 m r o f density n u momentum i v momentum d e 0.4 w momentum z energy i l a m r o n 0.2 0.0 0.0 0.2 0.4 0.6 0.8 1.0 normalized rate Information Rate Curve • Energy Compaction – Few coefficients can efficiently represent functions • The Curve should be as vertical as possible near 0 rate
Filter Bank Implementation • G: High Pass Filter • H: Low Pass Filter
Image Example A Frame Another Frame
Image Example Average Difference
Image Example LvLh LvHh HvHh HvLh
Image Example LvLh LvHh HvHh HvLh
Dilations • Rescaling Operation t --> 2t • Down Sampling, n --> 2n • Halve function support • Double frequency content • Octave division of spectrum- Gives rise to different scales and resolutions • Mother wavelet! - basic function gives rise to differing versions
Translations • Covers space-frequency diagram • Versions are
Wavelet Decomposition • Induced functional Space - Wj. • Related to Vjs • Space Wj+1 is orthogonal to Vj+1 • Also • J-level wavelet decomposition -
Wavelet Expansion • Wavelet expansion (Tiling- j: scale, k: translates), Synthesis • Orthogonal transformation, Coarsest level of resolution - J • Smoothing function - f, Detail function - y • Analysis: • Commonly used wavelets are Haar, Daubechies and Coiflets
Scaling Functions • Compact support • Bandlimited - cut-off frequency • Cannot achieve both • DC value (or the average) is defined • Translates of f are orthogonal