Download
1 / 18
180 likes | 370 Views
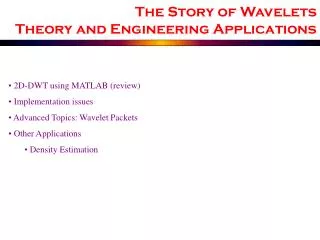
The Story of Wavelets Theory and Engineering Applications. 2D-DWT using MATLAB (review) Implementation issues Advanced Topics: Wavelet Packets Other Applications Density Estimation. Recall: 2D-DWT.

E N D
The Story of WaveletsTheory and Engineering Applications • 2D-DWT using MATLAB (review) • Implementation issues • Advanced Topics: Wavelet Packets • Other Applications • Density Estimation
Recall: 2D-DWT • Just like in 1D we generated an approximation of the 2D function f(x,y). Now, how do we compute the detail lost in approximating this function? • Unlike 1D case there will be three functions representing the details lost: • Details lost along the horizontal direction • Details lost along the vertical direction • Details lost along the diagonal direction • 1D Two sets of coeff.; a(k,n) & d (k,n) • 2D Four sets of coefficients: a(k,n), b(k, n), c(k, n) & d(k,n)
COLUMNS LL ~ ~ ~ ROWS H H H 2 1 1 2 1 2 COLUMNS …… LH INPUT IMAGE ~ ~ COLUMNS G G 1 2 1 2 ROWS …… HL ~ G 2 1 ROWS HH COLUMNS LLL LLH LH LHL LHH HH HL Implementation of 2D-DWT INPUT IMAGE LLH LH LL LH LL LHL LHH HH HH HL HL
1 2 2 1 1 2 Up and Down … Up and Down Downsample columns along the rows: For each row, keep the even indexed columns, discard the odd indexed columns 2 1 Downsample rows along the columns: For each column, keep the even indexed rows, discard the odd indexed rows Upsample columns along the rows: For each row, insert zeros at between every other sample (column) Upsample rows along the columns: For each column, insert zeros at between every other sample (row)
COLUMN j Implementing 2D-DWT Decomposition ROW i
1 2 1 2 1 2 1 2 2 1 2 1 Reconstruction LL H H LH G ORIGINAL IMAGE HL H G G HH
2-D DWT ON MATLAB Load Image (must be .mat file) Choose wavelet type Hit Analyze Choose display options
x[n] B: 0 ~ g[n] h[n] B: 0 ~ /2 Hz d1: Level 1 DWT Coeff. g[n] h[n] B: 0 ~ /4 Hz d2: Level 2 DWT Coeff. g[n] h[n] 2 2 2 2 2 2 B: 0 ~ /8 Hz ……. d3: Level 3 DWT Coeff. Recall 1-D DWT • In DWT, only approximation coefficients are decomposed. • Each decomposition allows dyadic dichotomization of the frequency spectrum • What if we were decompose the detail coefficients as well…? Frequency Time
D(1) A(1) G G H H /2 ~ 3/4 0 ~ /4 /4 ~ /2 3/4 ~ AD(2) DD(2) AA(2) DA(2) H H G G H G G H 0 ~ /8 /8 ~ /4 /2 ~ 5/8 /4 ~ 3/8 3/8 ~ /2 5/8 ~ 3/4 3/4 ~ 7/8 7/8 ~ AAA(3) DAA(3) ADA(3) DDA(3) AAD(3) DAD(3) ADD(3) DDD(3) Wavelet Packets : H H 2 x[n] B: 0 ~ H G 0 ~ /2 /2 ~
Wavelet Packets Frequency Time
What About Scaling and Wavelet Functions ??? You Ask… • In DWT, we used scaling functions to generate lowpass filters, and wavelet functions to generate highpass filters. • In WP analysis, filters are generated by related, but different analysis functions. Two-scale (dilation) equations where 2N: Filter length
How Many Decompositions Are Too Many??? • For a signal of length N=2L, we can have L levels of 1D-DWT. • For the same signal, we can have a maximum of 2N levels of decompositions • For a 512 sample signal x10123 13407807929942597099574024998206
Choosing the Best Tree • The best tree is the one that gives the most information. • What is “the most information”…you ask…. • Entropy based definitions • Normalized Shannon entropy • Norm based entropy • Energy based entropy • Threshold based entropy • If at any level, splitting a branch results in less sntropy, the splitting provides more information. • Matlab Demo: noisychirp
Density Estimation • Density:??? 3 5 4 5 3 7 9 8 7 3 4 5 10 7 3 4 5 7 14 12 10 3 5 4 7 9 9 3 4 5 5 4 5 4 3 7 3 4 4 5 6 5 6 7 5 5 4 3 3 4 5 6 8 10 10 2 3 1 1 0 0 3 3 4 5 6 3 2 HISTOGRAM Density function
Density Estimation • Density estimation allows us to infer statistical characteristics of data • From what distribution is the data coming • Reliability, life cycle • Average quality, etc. mean Number of “60W” bulbs Watts 60
Density Estimation • How do we estimate density??? • Matlab demo….Load ex1cusp2.mat from wavelet toolbox • Plot the data…What do you observe? Can you infer any information from this data? • Plot as “points”… What can you say now? • Plot the histogram of the data …>>hist(ex1cusp2) • Histogram can be used as a rough estimate of the density • Too noisy • Takes “every sample” into account, regardless how irrelevant (noisy) it may be • Better way? What else, but of course,…wavelets
Wavelets to the Rescue (again) • If the histogram is a noisy rough estimate of the density • Denoise histogram using wavelet shrinkage denoising Select wavelet Choose denoising thresholds Select number of bins Select thresholding scheme