Download

1 / 1
10 likes | 114 Views
The Association of Reasons for Not Drinking and the Decision to Abstain or Limit Alcohol Consumption. Amee J. Epler & Kenneth J. Sher University of Missouri-Columbia and the Midwest Alcoholism Research Center Supported by grants from NIAAA: R37 AA7231, P50 AA11998, and T32 AA13526 .

E N D
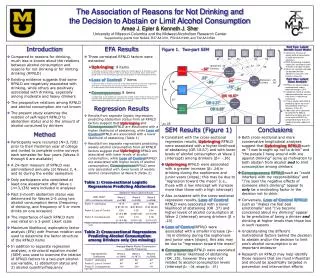
The Association of Reasons for Not Drinking and the Decision to Abstain or Limit Alcohol Consumption Amee J. Epler & Kenneth J. Sher University of Missouri-Columbia and the Midwest Alcoholism Research Center Supported by grants from NIAAA: R37 AA7231, P50 AA11998, and T32 AA13526 • Introduction • Compared to reasons for drinking, much less is known about the relations between alcohol consumption and reasons for not drinking or for limiting drinking (RFNLD) • Existing evidence suggests that some RFNLD are negatively associated with drinking, while others are positively associated with drinking, especially among moderate and heavy drinkers • The prospective relations among RFNLD and alcohol consumption are not known • The present study examines the relation of self-report RFNLD to abstention status and to the amount of alcohol consumed by drinkers • Method • Participants were recruited (N=3,720) prior to their freshman year of college and invited to complete online surveys each semester for four years (Waves 0 through 6 are available) • A 24-item measure of RFNLD was administered annually (at Waves 2, 4, and 6) during the winter semesters • Only participants who completed at least one assessment after Wave 1 (n=3,136) were included in analyses • Past 3-month abstention status was determined for Waves 2-6 using two alcohol consumption items (frequency of drinking, and frequency of 5 or more drinks on one occasion) • The importance of each RFNLD item was rated on a 3-point Likert scale • Maximum likelihood, exploratory factor analysis (EFA) with Promax rotation was used to determine the factor structure of the RFNLD items • In addition to separate regression analyses, a structural equation model (SEM) was used to examine the relation of RFNLD factors to a two-part alcohol-use variable, 1) abstention status and 2) alcohol quantity/frequency • EFA Results • Three correlated RFNLD factors were extracted • Upbringing: 9 items 1) brought up not to drink 2) against religion 3) friends against 4) drinking is a sign of personal weakness 5) don’t want to get drunk 6) concerned about what others would think 7) not old enough legally 8) group against 9) would disappoint parents • Loss of Control: 7 items 1) become rude or obnoxious 2) fear of becoming alcoholic 3) someone suggested I drink less 4) I’ve become concerned 5) makes me feel bad emotionally 6) embarrassed myself while drinking 7) reduced performance in sports • Consequences: 8 items 1) tastes bad 2) not healthy 3) could get into trouble 4) feel ill after drinking 5) could interfere with responsibilities 6) expensive 7) seen the negative effects of someone else’s drinking 8) might not be able to control myself Regression Results • Results from separate logistic regressions predicting abstention status from all RFNLD factors suggest thatUpbringingandConsequencesRFNLD are associated with a higher likelihood of abstaining, whileLoss of ControlRFNLD are associated with a lower likelihood of abstaining (Table 1) • Results from separate regressions predicting weekly alcohol consumption from all RFNLD factors suggest thatUpbringingRFNLD are associated with lower levels of alcohol consumption, whileLoss of ControlRFNLD are associated with higher levels of alcohol consumption;ConsequencesRFNLD were only associated with lower levels of weekly alcohol consumption at Wave 6 (Table 2) Table 1: Cross-sectional Logistic Regressions Predicting Abstention § Odds of being one standard deviation above the mean compared to being at the mean Table 2: Cross-sectional Regressions Predicting Alcohol Consumption among Drinkers only (no missing) * p< .05 Part Two: Latent Growth Curve Model Figure 1. Two-part SEM • Continuous measure of weekly alcohol consumption at each wave for non-abstainers • RFNLD predicting (standard regression) continuous latent intercept and slope variables • Means for intercept and slope are provided for both Abstainers (Class #1) and Drinkers (Class #2) QF W2 QF W3 QF W4 QF W5 QF W6 .86 .92 .93 .96 .96 .54 Abstainers .42* Drinkers .97* .32 .66 .20 0 Upbringing -.36* Alcohol QF Intercept -.38* .23* Alcohol QF Slope Part One: Latent Class Analysis Abstainers -.05 Drinkers .08* .24* -.04 .38* • RFNLD are represented by centered factor scores obtained through a CFA • Categorical manifest variable indicating abstention status at each wave (1=abstaining, 0=drinking) • 2-Class solution with RFNLD predicting (logistic regression) the probability of being an abstainer (Class #1) • Odds ratios were calculated to compare the odds of abstaining for those who are at the mean of RFNLD as compared to those that are 1 standard deviation above the mean -.16* Loss of Control -.01 .76* OR 10.67* .50* Abstention Class OR 0.37* Conse- quences OR 0.25* Abst W2 Abst W3 Abst W4 Abst W5 Abst W6 * p<.05 • SEM Results (Figure 1) • Consistent with the cross-sectional regression results,Upbringing RFNLD were associated with a higher likelihood of abstaining (OR 10.67) and with lower levels of alcohol consumption at Wave 2 (intercept) among drinkers (β= -.36) • Upbringing RFNLD were associated with a greater increase (β= .24) in drinking during the sophomore and junior years (slope); this may be due to “regression toward the mean” (i.e., those with a low intercept will increase more than those with a high intercept) • Also consistent with the cross-sectional regression results,Loss of Control RFNLD were associated with a lower likelihood of abstaining (OR .37) and higher levels of alcohol consumption at Wave 2 (intercept) among drinkers (β = .23) • Loss of Control RFNLD were associated with a smaller increase (β= -.16) in drinking during the sophomore and junior years (slope); this also may be due to “regression toward the mean” • Consequences RFNLD were associated with a lower likelihood of abstaining (OR .25), however they were not related to alcohol consumption levels (intercept β= -.04; slope β= -.01) • Conclusions • Both cross-sectional and more conservative longitudinal analyses suggest thatUpbringing RFNLDsuch as “I was brought up not to drink” and “the people I hang around with are against drinking” serve as motivation to both abstain from alcohol and to limit consumption among drinkers • Consequences RFNLDsuch as “could interfere with my responsibilities” and “I’ve seen the negative effects of someone else’s drinking” appear to only be a motivating factor in the decision not to drink • Conversely,Loss of Control RFNLDsuch as “makes me feel bad emotionally” and “I’ve become concerned about my drinking” appear to be predictive of being a drinker and drinking at higher levels than those low in such reasons • Understanding the different motivational factors behind the decision to abstain and/or the decision to limit one’s alcohol consumption is an important endeavor • Research on RFNLD may help identify those reasons that are most influential and should be specifically targeted in prevention and intervention efforts