Download
1 / 26
260 likes | 373 Views
This initiative focuses on developing peer groups for dairy producers in Kansas, aiming to enhance operational efficiencies and financial performance in the face of market volatility. By providing benchmarking measures and educational opportunities, producers can evaluate their farms' strengths and weaknesses, improve milk production, and manage risks effectively. The quarterly meetings include data analysis sessions and discussions on topics such as marketing, herd management, and feed strategies, empowering participants to make informed decisions and foster collaboration.

E N D
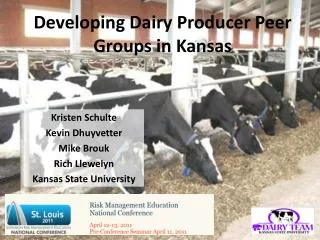
Developing Dairy Producer Peer Groups in Kansas Kristen Schulte Kevin Dhuyvetter Mike Brouk Rich Llewelyn Kansas State University
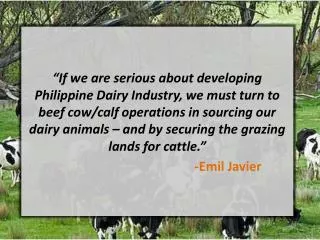
Kansas Dairy Industry • 2010 • 17th U.S. Milk Production • 0.4% increase in milk production since 2009 • 9th in 3-year annual milk production growth • 11th Milk pounds/cow/day • 21,000 rolling herd average • 13th average herd size • 305 cows (119,000 total cows) • 390 licensed herds Progressive Dairyman, 2010 U.S. Dairy Statistics & USDA, National Agricultural Statistics Service
Opportunities • Variable dairy enterprise returns due to increase of volatility in milk and feed prices • Structurally diverse dairy operation types between regions in Kansas • Limited individual farm benchmark comparison for all types of dairies • Risk management education to reduce financial risk
Objectives • Provide benchmark measures so producers can evaluate their own operations and make plans to change their operations based on this information • Assist producers in analyzing strengths and weaknesses of their operations • Evaluate how milk revenue relates to inputs in order to manage the financial and production related risks • Educate and provide peer-learning opportunities related to marketing, and herd, feed, and employee management
Peer Group Meeting Quarterly meetings comprised of two sections: • Benchmarking • report results for key production and financial measures such as price, production, reproduction rates, culling rates, and feed prices. • Individual and group statistical measures are reported allowing producers to benchmark their farm over time and to the group’s measures. • General education • Topic chosen by the group such as marketing, new aspects of production and technology, and feed management.
Current Participation • 8-11 dairy operations per group • 3 producer peer groups • 29 total operations • 1 group with 6 quarters of data • 2 groups with 2 quarters of data • Farm size range: ~100 – 700 cows • Industry support from local financial institution, feed supplier, and veterinarian • Utilize Excel and Word to collect data via e-mail correspondence with producers
Meeting Outline • 10:30 Welcome • 10:45 – 12:15 Educational session (topics picked jointly by producers and KSU) • 12:30 – 1:00 Lunch • 1:15 – 2:30 Analysis of benchmark data and DHIA records • 2:30 Farm tour
Meeting Preparation Outline • Pre Meeting • Finalize quarterly meeting plans • E-mail reminder for meeting and submission of farm benchmark input data • Collect, compile, and analyze farm benchmark data • Prepare benchmark reports for group and individual farms • Post Meeting • Update farm data with changes highlighted in meeting • Prepare and send next quarters’ input data sheets • Follow-up with producers from prior meeting
Benchmark Data – Milk Production • Record: • Entry comes directly from milk check • Lbs milk sold and used on farm • Milk price received (producer premiums and deductions) • Output: • Milk shipped/cow/day • Milk income/cow/day • Component levels • Hauling cost/cwt milk • Milk price received
Producers enter milk check data into a spreadsheet each quarter (blue values are inputs, other values are calculated).
Benchmark Data – Herd Inventory • Record: • Total cow and heifer inventory • Number of cull animals • Transition cow complication frequency • Veterinary cost • Output • Heifer-to-cow ratio • Cull rates (Cows: <60 and >60 DIM; abortion; stillborn; Heifers:<2, 3-8, and >9 months) • Veterinary cost per head • Rate of transition cow complication
Producers enter monthly cow inventory data into a spreadsheet each quarter (blue values are inputs, other values are calculated).
Benchmark Data - Feed • Lactating, dry, and transition cows • Record for each feed ingredient: • Value/ton • Dry matter percentage • Total poundsfed per group • Output: • Pounds fed/cow, DM basis • Feed cost/cow/day • Feed cost/cwt shipped/day • Major feed component cost comparison • Income over feed cost
Producers enter monthly feed prices and quantities into a spreadsheet each quarter (blue values are inputs, other values are calculated) for each diet (up to four lactating diets, one transition cow diet, and one dry cow diet).
Benchmark Data - Reproduction • Record: • Breeding rate per given 21-day interval • Pregnancy rate per given 21-day interval • Conception rate, number monthly services and successes • Output (6 month average): • Breeding rate • Pregnancy rate • Conception rate per lactation and number of services
Producers enter monthly data regarding number of services and number of successful conceptions into a spreadsheet each quarter (blue values are inputs, other values are calculated).
Benchmark Data - Output • Statistical Analysis (group) • Average, maximum, minimum • Farm Data • Current quarter • Prior quarter • Current quarter, historical year • Rolling year average
Additional Education • Feed inventory, shrink analysis • Cost of production – corn silage • Labor - hours per task category • Educational sessions • Commodity markets and marketing options • Utilizing DHIA records in transition cow management • Vaccination protocols • SCC and udder health • Foot care roundtable
Concluding Thoughts • Continuous learning and development of materials • Producers are still learning (approximate two quarter learning curve) • Feedback has been positive • Time commitment bigger than anticipated(haven’t been able to get producers to provide leadership) • Excel and email capabilities essential • Informal networking / camaraderie might be as important as formal topics presented
THANK YOU Kristen Schulte, schulte@ksu.eduKevin Dhuyvetter, kcd@ksu.edu