Download
1 / 6
60 likes | 77 Views
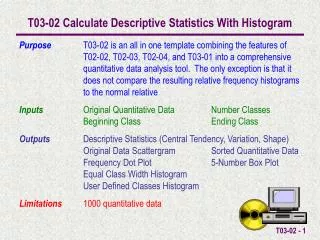
This tutorial guides you on creating a statistics histogram for your course. Follow step-by-step instructions to fill in course data, statistics table, and generate a histogram. Input your course figures, edit the histogram, and save your work for submission.

E N D
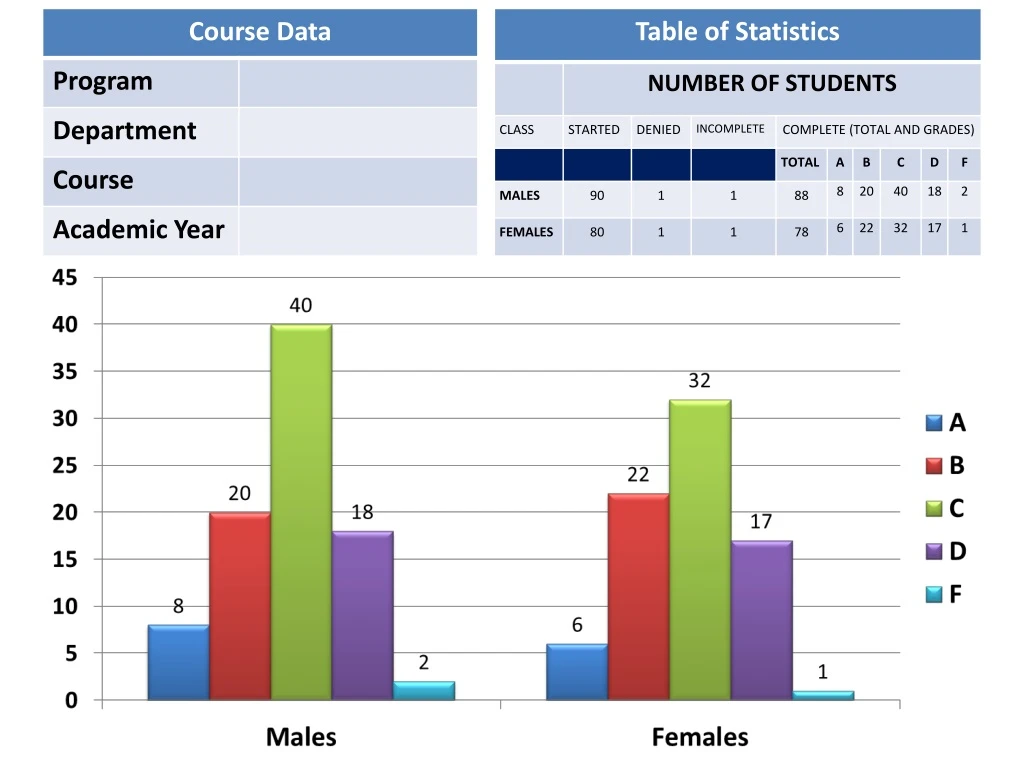
Instructions on Making your Course Statistics Histogram In the first slide there are 3 components: • Course Data: Please complete the details of your course first. • Table of Statistics: Please fill it in with the accurate statistics of your course. Please note that the figures shown in the table are hypothetical. You need just to change them with the figures specific to your course. • Histogram (Chart): • After you fill-in the table with the figures specific to your course, double-click the chart area. A dialog box will appear (see slide 4 below). Click on “Convert”. • The shape of the toolbar ribbon will change and will give you the tools for editing the histogram.
Cont’d: • In the toolbar, click on “Edit Data” (see slide 5 below). • The screen will be divided vertically to show a spreadsheet (Microsoft Excel sheet) on the right, that contains the hypothetical data (see slide 6 below). • Change the figures with your course’s figures (number of students in A, in B, in C, and so on). The histogram will change accordingly. • Close the Excel sheet and save your work. • Delete the slides 2 to 6 (and keep only the first slide that contains the histogram). • Rename your file to “Program_Year_Course_Acdemic Year” (for example: “MBBS_6_Surgery_2014”) and submit it to meu.ibnsina@gmail.com. DEADLINE IS THIS WEDNESDAY @ 10:00 AM
![[Image Similarity Based on Histogram]](https://cdn0.slideserve.com/1309335/image-similarity-based-on-histogram-dt.jpg)


![[Image Similarity Based on Histogram]](https://cdn5.slideserve.com/9279474/image-similarity-based-on-histogram-dt.jpg)