
Population Dynamics
Changes in a population How do we define a population?. Population Individuals of a single species Occupy the same area Rely on the same resources Affected by same environmental factors Interact and breed. Population Dynamics. Why does it matter?.

Population Dynamics
E N D
Presentation Transcript
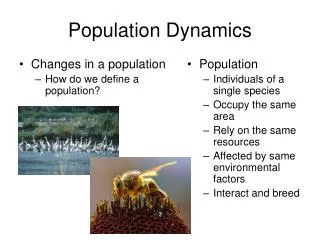
Changes in a population How do we define a population? Population Individuals of a single species Occupy the same area Rely on the same resources Affected by same environmental factors Interact and breed Population Dynamics
Why does it matter? • How long does it take bacteria to proliferate into the millions? • E. coli can double in less than 20 minutes • Can reach many millions in a few hours
If the environment is not ideal • How does our body affect bacterial growth? • with wbc, release specific protein, stimulates a hormone that raises body temp • How do treatments (antibiotics) affect bacterial growth? • Alters or poisons their environment…halts growth
Why does it matter? …more examples • Insect pests? • Can wipe out crops • Introduced species can destroy an entire ecosystem. e.g. Caulerpa taxifolia
Linear growth Example--2,4,6,8,10,12,14,.... Produces a linear graph. Doubling occurs relatively slowly. Exponential growth Example--2, 4, 8, 16, 32, 64, 128.... Produces an exponential (logarithmic) graph--a "J" curve. Doubling occurs rapidly. Populations tend to grow exponentially, when there are no limits to growth.
produce environmental resistance converts a "J" curve to an "S" curve = logistic growth e.g. space and hunting restricted elephant seals & sets the carrying capacity (environmt. support) Limiting factors…
Population may stabilize if resources are renewable, and growth was not too severe. Population may crash if resources are non-renewable or if growth outpaces renewal.
Density dependent Factors that limit growth more severely as the population increases Biotic E.g. food, nutrients, disease, etc. Density independent Factors that effect population in a consistent way whether there are few or many individuals. Abiotic E.g. weather, climate, etc. Limiting factors
Assuming current trends… 10-12 billion Low range est. At U.S. dietary standards.... 1.2 billion At U.S. energy consumption.... < 1 billion What is the human carrying capacity for earth?
What is the human carrying capacity for earth? • High range estimates… 45 billion or more if the following conditions met. • Cultivating all arable land • Mass conversion to nuclear power & renewable resources • what do we do with spent fuel? • Expansion of mining, perhaps to crustal depths of 1 mile. • These high estimates assume technologies that do not yet exist. • Some estimate that the carrying capacity could be as much as 157 billion if the population shifted to a grain diet.
Regional differences Sweden very stable Birth rates E.g. 28 births per 1000 people Death rates E.g 11 deaths per 1000 people Today’s rates? Zero population growth (ZPG) birth rates = death rates World population depends largely on…


