Population Dynamics
Population Dynamics. Population dynamics. The pattern of any process, or the interrelationship of phenomena, which affects growth or change within a population. The study of the factors that affect the growth, stability, and decline of populations, as well as the interactions of those factors.


Population Dynamics
E N D
Presentation Transcript
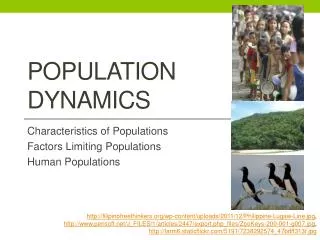
Population dynamics • The pattern of any process, or the interrelationship of phenomena, which affects growth or change within a population. • The study of the factors that affect the growth, stability, and decline of populations, as well as the interactions of those factors. • A term that describes the ways in which a given population's numbers grow and shrink over time, as controlled by birth, death, and emigration or immigration.
A wildlife population is a group of individuals of the same species that have some basis of commonality. Populations can be linked to a feature in the landscape, to other populations, or a time period for example.
All populations have the potential for exponential growth All populations have the potential for explosive growth i.e. the growth of a population without any constraints; therefore, the population will grow at an ever-increasing rate. naturalsciences.sdsu.edu/classes/lab2.7/glossary.html
But typically, a population in an environment stops growing exponentially long before it reaches the environmental carrying capacity. What reasons can you think of ?
Population growth is limited by abiotic and biotic interactions.
Limiting factors Are those elements that prevent a population from attaining its biotic potential (maximum growth rate) Limiting factors are categorized into density-dependent and density- independent factors
Density dependant factors Predation - predators may be attracted to areas with higher densities of their prey.
Competition for resources - depletion of food supply = poorer nutrition = increased death rates = decreased birth rates.
Infectious disease - diseases can spread more easily in dense populations than in sparse populations.
Density independent factors • hurricanes • floods • fire • pollution • habitat destruction
Age Structure Lifespan Sex RatioNatality & Mortality Interspecific DynamicsIntraspecific Dynamics Territoriality & Home Range Dispersal Carrying Capacity
Age Structure The proportional amounts of young and old age classes reveal much about a population. There should be some kind of balance among the classes and the "proper" balance will vary by species and season. Generally, the age structure can be depicted by a triangle, with the numerous young on the bottom and very few older individuals at the top.
"Age" might be measured in years, weeks, or days, depending upon the species considered. At the end of the food-rich season, the youngest age classes are usually swollen. The winter will kill many individuals, but usually the young and very old experience the highest mortality rates. Humans sometimes have a strong impact on the age structure of a population.
White-tailed deer have few animals beyond 4.5 or 5.5 years largely because of hunting pressure, although an individual is capable of living a decade or more. A heavily fished lake may reduce the number of sizable (older) adults to the point where breeding might be reduced.
Lifespan Obviously, different species have different life spans. Most insects complete their life cycles during the warm season. Some have multiple generations during that time. Other species live for years and individuals must have adaptations and adequate habitat to survive regular periods of food-shortages and inclement weather.
Species toward the end of food chains are usually much longer-lived that those in the beginning. Long-lived species have strategies that favour the survival of fewer individuals. Shorter-lived species generally utilize the opposite strategy (r & K strategists) The combination of lifespan and age structure reveal much about the general health of a population, either a wildlife population or a stand of trees.
Sex Ratio Each species has an "ideal" sex ratio. Usually this is somewhere around 50:50, but not necessarily. Honeybees, for example, have almost no males. A particular sex ratio will help maximize "fecundity", or the ability of a species to produce new individuals. Males of some species will mate with as many females as possible. Other species, such as swans and geese, tend to be more monogamous.
Natality and Mortality Natality is the inherent ability of a population to increase in numbers. Mortality deals with the level of death within a population. These terms are usually expressed as rates that reflect pressures to increase and decrease population size. The size of a population is impacted by many factors, which vary over time.
At a particular point in time, natality factors or mortality factors may dominate, causing a population to increase or decrease. Some factors are fairly predictable, such as the average clutch/litter size or the onset of winter. Other factors, such as extreme weather events or disease epidemics, can have great impacts but are not predictable.
Interspecific Dynamics These are relationships among or between species. The predator-prey relationship is a well-known example of an interspecfic dynamics. Interspecific dynamics can be antagonistic or beneficial. Lichens are two species (an algae and a fungus) working in concert to the benefit of both. This is called a "mutualistic" relationship.
A "commensal" relationship is where one species requires another, but the host is relatively unaffected. Another kind of interspecific relationship would be parasitic. Mosquitoes draw blood essential to the completion of their life cycle, at the expense of another species.
Species that require something from another species are termed "obligate". When the relationship is beneficial but not required, it is termed facultative".
Intraspecific Dynamics There are relationships among individuals of a population. Competition for food, shelter, and other requirements are common examples. Mating and establishing territories are other examples. A species might be colonial in nature or live primarily as individuals. There are many life strategies.
Territoriality and Home Range An individual or population of a species may actively mark and/or defend a particular area. The male robin that challenges anything resembling another male robin is expressing "territoriality". A "home range" is the amount of space an animal needs acquire the resources to meet its needs. A predator such as a wolf may have a home range of many square miles, while an earthworm has almost none.
The amount of area for either a territory or home range is not necessarily constant. It often varies with the season. After the breeding season, male robins resume a gregarious nature. Ruffed grouse will "expel" their young before the onset of winter because winter home ranges are larger than summer home ranges. The young animals must seek their own new habitat.
Dispersal Dispersal is movement of individuals or their offspring into or out of an area. Dispersal allows individuals to colonize new areas of crop fields. Dispersal, along with birth and death rates, regulates population size, and plays an important role in evolution through mixing of genes between populations.
Dispersal is accomplished through immigration (movement into a population), emigration (movement out of a population) or migration (frequent movement into or out of a population area).
Winters and dry seasons result in less available food and water. Animals have a wide range of strategies to accommodate these seasonal fluctuations. Migration is one such strategy. Autumn bird migration is the most familiar. Many species of birds fly south more because of food shortages, rather than cold temperatures.
Carrying Capacity The physical and biological resources of an area, varying with the season, will support only so many individuals. This maximum amount called the "carrying capacity". When most species approach their particular carrying capacity, mortality factors overtake natality factors and the population growth declines.
For some species, this ecological balancing-act is fairly regulated without great fluctuations. With other species, there is a normal "boom and bust" cycle. Ruffed grouse and snowshoe hare populations are good examples.
There are a few species that can maintain high population densities long enough to actually damage their habitat and substantially reduce the carrying capacity. Deer and moose are classic examples of species than can damage their habitat. Humans may very well fall into this category, as well.
Life tables & survivorship curves A survivorship curve is a graph showing the number or proportion of individuals surviving at each age for a given species or group (e.g. males/females). Survivorship curves can be constructed for a given cohort (a group of individuals of roughly the same age) based on a life table.
Type I: Convex The line of the Type I survivorship curve begins high on the graph and continues across all young and middle-age groups. It indicates a low death rate of young and middle-aged individuals. A large proportion of individuals of each age survive to the next age; thus, a large proportion live to old age. The curve drops steeply as individuals reach old age, because mortality becomes high at old age. This type of curve is associated with humans and other large mammals, that produce few offspring during their lifetimes. The young are dependent on parental care for an extended period of time.
Type II: Linear Type II survivorship curves exhibit a constant, downward slope. The same proportion of the population survives at all ages. Type II is the intermediate between Type I and Type III curves, indicating a constant mortality rate and birth rate. Type II is associated with many small mammals, birds, various invertebrates, some reptiles and annual plants follow this pattern of survival. Young are dependent upon parental care, but for a shorter period of time.
Type III: Concave Type III is the opposite of Type I. The curve begins with an immediate, steep, downward slope, and levels off while individuals are still young. In these populations, mortality remains high among the very young. The shallow slope continues through old age. This type of survivorship curve indicates that if individuals survive their youth, they will likely survive to old age. Type III curves are associated with fish and other organisms that produce thousands of young, but provide little to no parental care.
Type I – most mortality among older individuals • Type II – constant rate of mortality • Type III – highest mortality in young