Efficient Cube Analysis Guide for Data Exploration
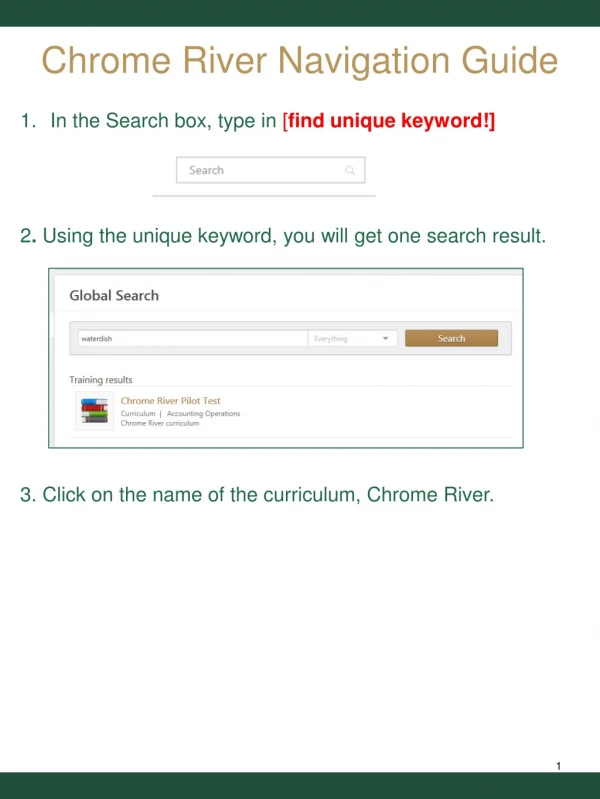
Learn how to navigate and analyze data cubes effectively using dimension viewers and display tools in this comprehensive training guide excerpt. Explore various features and actions for insightful data interpretation.

Efficient Cube Analysis Guide for Data Exploration
E N D
Presentation Transcript
VisionTrack Navigation Guide Excerpt of online training guide and instruction design, Winter 2006
Accessing Cubes The folder displays all reports you can access. This view displays both standard (pre-defined) reports and cubes. Cubes are denoted by the cube image: Click on the cube for the data you wish to access (for example, RV-B Outsourcing Revenue cube). The cube must be accessed each time you wish to analyze the data.
Cube Features Dimension Line– allows you to filter the data from each dimension in the cube. Display– shows the data from the cube. Dimension Viewer– shows the hierarchical structure of the data and is used to filter data from each dimension in the cube. Display Toolbar– allows you to select different displays, apply suppression, and export or save your report. Level Selector Areas– allows you to drill in or out of the categories.
Dimension Viewer Hide/Show Dimension Viewer button • The dimension viewer shows a full tree view of the dimensions and measures in a cube. This view helps you understand the data structure and find the items you require. In the dimension viewer, you see an organized view of all dimensions, levels, and categories in a selected cube in a Windows folder-like presentation. You can right-click the categories or use the dimension view toolbar to perform actions on the data. • In the dimension viewer, the following actions can be accomplished using right-clicking: • Change a row or column • Change a measure or add new measures to your report • Create a nested crosstab or chart • Filter – which is to change a measure • By selecting a dimension or category below it and then selecting one of the toolbar icons you can insert before/after or replace rows & columns. Right-Click Menu Dimension View Toolbar (to show toolbar, right click in the dimension viewer box and select show toolbar)
Level Selector Toolbar/Menu Insert snapshot 006 – highlight yellow like this one Left-click the row and column level selector areas to open the level selector toolbar, or right-click to display the level selector menu. Both allow manipulation of the dimensions in the same way. The level selector contains the following actions button or selections: Expand - Expands the category to show the next level of data. Delete - Deletes the level of data shown. Swap Left - The selected row category becomes the parent of the nested level. Swap Right - The selected row category becomes the nested level. Swap Up - The selected column category becomes the parent of the nested level. Swap Down - The selected column category becomes the nested level. Down a Level - The data changes to show the next-lower level of data in the category. Up a Level - The data changes to show the next-higher level of data in the category. Explain - Shows an explanation of the information you are exploring.
Display Toolbar Rank 80/20 Supprs. Custom Subsets Help Hide/ Show Options Cross- tab Chart Swap Zero Suppress. Exception Highlight File Calculation • Crosstab – Toggles the display between normal crosstab view and indented crosstab view which indents levels of nested categories for easier category relationship identification. • Chart – Allows you convert the display to various chart types (Bar, Pie, Line, 3D, etc). • Options – Allows you to set the display, add a report title, split view chart/crosstab, get data later, and reset the report to original settings. • Swap – Allows you to exchange the positions of categories in rows and columns for improved view. • Hide/Show – Allows you to selectively show or hide any category in a report. When categories are hidden the report summaries are not affected. The selected column category becomes the parent of the nested level. • Calculation – Allows you to perform custom calculations (+, -, x, /, %, etc.) on rows or columns to obtain a new item. • Rank – Allows you to add rank categories to reports to show rank ordinals (i.e. which company had the highest turnover). • Zero Suppression – Allows you to remove rows or columns containing zeros on rows, on columns or both. • To apply zero suppression to rows and columns, click Zero Suppression • To apply zero suppression to rows only, click Rows only. • To apply zero suppression to columns only, click Columns only. • 80/20 Suppression – Allows you to remove rows or columns whose absolute values do not contribute to the top 80% of the results. • Custom Exception Highlighting – Allows you to automatically apply custom formatting to data that meets exception conditions. • Custom Subsets – Allows you to create a group of categories contained in a dimension that appear in a separate, customized category defined by user’s criteria. • File – Allows you to export the report as PDF, CSV or XLS. You can also prepare a bookmark, the first step in saving the report as a bookmark. • Help – Allows you to access the Cognos help window where you can get subject specific help for the novice to experienced user.