Download
1 / 15
160 likes | 333 Views
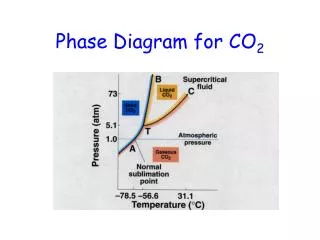
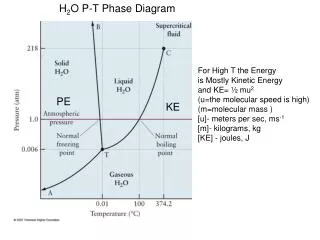
H 2 O P-T Phase Diagram. For High T the Energy is Mostly Kinetic Energy and KE= ½ mu 2 (u=the molecular speed is high) (m=molecular mass ) [u]- meters per sec, ms -1 [m]- kilograms, kg [KE] - joules, J. PE. KE. • What is Temperature(T)? • What is pressure(P)? • What is volume(V)?

E N D
H2O P-T Phase Diagram For High T the Energy is Mostly Kinetic Energy and KE= ½ mu2 (u=the molecular speed is high) (m=molecular mass ) [u]- meters per sec, ms-1 [m]- kilograms, kg [KE] - joules, J PE KE
• What is Temperature(T)? • What is pressure(P)? • What is volume(V)? • N=number of particles(atoms/molecules) • N/V= number density( number per unit volume)
Van der Waals Potential Curves E= KE + V(R) For gases KE>> V(R) e s Fig. 9-18, p. 392
Zero energy turning point Bond energy Table 9-4, p. 392
Van der Waals Potential Curves E= KE + V(R) For gases KE>> V(R) e s Fig. 9-18, p. 392
H2O P-T Phase Diagram For High T the Energy is Mostly Kinetic Energy and KE= ½ mu2 (u=molecular speed is high) (m=molecular mass ) [u]- meters per sec, ms-1 [m]- kilograms, kg [KE] - joules, J PE KE
Measuring the speed distribution in a gas Effusion cell Solid or liquid sample Fig. 9-19, p. 394
Effusive beam used to mDx/easure speed distribution u=Dx/Dt For He with u=500 ms-1 m= 4 amu KE= ½ (4 amu)(500 ms-1)2 (1.66x10⁻²⁷ kg)(500,000m2s-2) KE=8.3 x10⁻²² J Dx Speed Fig. 9-13, p. 383
<u>=(8kBT/πm)1/2 average speed <u2>=(3kBT/m) average square speed urms= (3kBT/m)1/2 root mean square speed ump = (2kBT/m)1/2 most probable spped Fig. 9-14, p. 384
Van der Waals Potential Curves E= KE + V(R) For gases KE>> V(R) e s Fig. 9-18, p. 392
<u>=(8kBT/πm)1/2 average speed <u2>=(3kBT/m) average square speed urms= (3kBT/m)1/2 root mean square speed ump = (2kBT/m)1/2 most probable spped Fig. 9-14, p. 384
Effusive beam used to mDx/easure speed distribution u=Dx/Dt For He with u=500 ms-1 m= 4 amu KE= ½ (4 amu)(500 ms-1)2 (1.66x10⁻²⁷ kg)(500,000m2s-2) KE=8.3 x10⁻²² J Dx Speed Fig. 9-13, p. 383