Download
1 / 27
280 likes | 437 Views
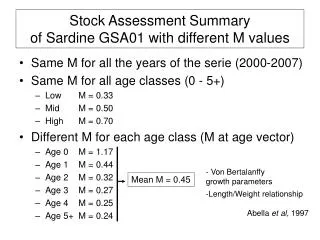
Stock Structure of Pacific Sardine ( Sardinops sagax ), an ongoing question. John R. Hyde Southwest Fisheries Science Center, La Jolla. Tools at our disposal. Catch and ichthyoplankton data Morphometry whole fish meristics otolith Artificial tagging

E N D
Stock Structure of Pacific Sardine (Sardinops sagax), an ongoing question John R. Hyde Southwest Fisheries Science Center, La Jolla
Tools at our disposal • Catch and ichthyoplankton data • Morphometry • whole fish • meristics • otolith • Artificial tagging • large scale studies in the 1930’s & 40’s • Natural tagging • parasites • chemical/isotopic signatures in otoliths • Genetic analyses • blood type • allozymes • mtDNA sequencing • microsatellites
Tools at our disposal • Catch and ichthyoplankton data • Morphometry • whole fish • meristics • otolith • Artificial tagging • large scale studies in the 1930’s & 40’s • Natural tagging • parasites • chemical/isotopic signatures in otoliths • Genetic analyses • blood type • allozymes • mtDNA sequencing • microsatellites
Temporal shifts in spawning areas Smith 2005
Variable Catch with SST Felix-Uraga et al. 2005
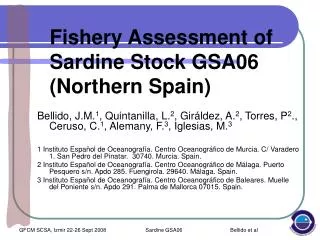
Felix-Uraga et al. 2005 The 3 Stock Hypothesis Felix-Uraga et al. 2005
Tools at our disposal • Catch and ichthyoplankton data • Morphometry • whole fish • meristics • otolith • Artificial tagging • large scale studies in the 1930’s & 40’s • Natural tagging • parasites • chemical/isotopic signatures in otoliths • Genetic analyses • blood type • allozymes • mtDNA sequencing • microsatellites
“warm” Body Morphology “cold” “temperate” “cold” Garcia-Rodriguez et al. 2011 “warm” Hedgecock et al. 1989
Variability in Otolith shape Felix-Uraga et al. 2005
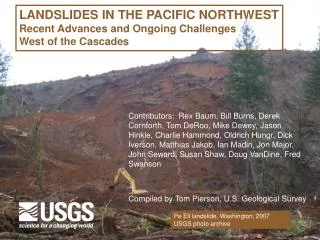
Otolithmorphometry(the frill factor) Javor et al 2011 Otolith measurements greater than predicted (50% = average of all otoliths). Number of otoliths for each region indicated on the graph (total = 4147 otoliths).
Otolithmorphometry(the frill factor) Javor et al 2011 Frilly and light Smooth and heavy Average Average Otolith measurements greater than predicted (50% = average of all otoliths). Number of otoliths for each region indicated on the graph (total = 4147 otoliths).
Tools at our disposal • Catch and ichthyoplankton data • Morphometry • whole fish • meristics • otolith • Artificial tagging • large scale studies in the 1930’s & 40’s • Natural tagging • parasites • chemical/isotopic signatures in otoliths • Genetic analyses • blood type • allozymes • mtDNA sequencing • microsatellites
Tagging Studies • Large numbers of fish tagged along Pacific Coast and recovered in canneries • Movement of fish between Canada and San Diego • Northern Baja fish showed limited northward movement • No tag returns from Southern Baja
Tools at our disposal • Catch and ichthyoplankton data • Morphometry • whole fish • meristics • otolith • Artificial tagging • large scale studies in the 1930’s & 40’s • Natural tagging • parasites • chemical/isotopic signatures in otoliths • Genetic analyses • blood type • allozymes • mtDNA sequencing • microsatellites
Parasites as natural tags • trematode Lecithaster gibbosus suggests retention of locally spawned fish in the Pacific NW • trematode Myosaccium ecaude supports coastwide migration Baldwin et al. 2011
Oxygen Isotope studies Isotope values used to extrapolate average temperature conditions experienced by sardine (circles). Dashes denote monthly average SST at location. Valle & Herzka 2008
Oxygen Isotope studies Isotope values used to extrapolate average temperature conditions experienced by sardine (circles). Dashes denote monthly average SST at location. Valle & Herzka 2008
Tools at our disposal • Catch and ichthyoplankton data • Morphometry • whole fish • meristics • otolith • Artificial tagging • large scale studies in the 1930’s & 40’s • Natural tagging • parasites • chemical/isotopic signatures in otoliths • Genetic analyses • blood type • allozymes • mtDNA sequencing • microsatellites
Challenges for Population Genetics • Known migratory behavior • Geographic overlap but temporal separation? • Repeated large-scale population fluctuations • Multiple population bottlenecks? • Human mediated gene flow • Transport and release of sardine by sportfishing vessels • How to address these challenges? • Large sample size and/or large number of genetic markers • Discrete temporal sampling to address hypothesized movements of stocks • Range-wide sampling
Variations in Blood Type Smith 2005
Variations in Blood Type Smith 2005
Genetic Studies and the Goldilocks Problem • Allozymes – not enough variation • Hedgecock et al. 1989 – 32 allozyme loci • “There is so little variation within and between Pacific sardine populations that it is not possible to test whether distributions of genotypes conform to the expectations of random mating or whether allelic frequencies are heterogeneous throughout the range of populations sampled. That sardines in widely separated localities have the same rare alleles suggests strongly, however, that there has been substantial gene flow among contemporary populations.” • Mitochondrial DNA sequences - too much variation • Microsatellites – way too much variation • 17 microsatellite loci (Pereyra et al. 2004, Hyde unpublished) • 21-72 alleles per locus (mean = 44.1) Garcia-Rodriguez et al. 2011
Collection info and hypothesized stock membership Felix-Uraga et al. 2005
Pairwise Population comparisons Pairwise FST values below diagonal, p-values above diagonal. Significant values in bold
AMOVA Adjacent Sample Pooling Analyses ???? Cold Stock Warm Stock Temperate Stock FCT 4 Groups FST = 0.00093, p = 0.07 FSC = 0.00059, p = 0.36 FCT = 0.00035, p = 0.03
Conclusions and Future Directions • Tagging data supports coastwide migratory behavior • Evidence exists for geographically associated phenotypic heterogeneity • Likely driven by environmental conditions • Low to no genetic heterogeneity • The need for markers under natural selection • Heterogeneity in otolith oxygen isotopes • Driven by environmental conditions • A need for a comprehensive rangewide survey