Download
1 / 20
200 likes | 335 Views
Oregon and Washington Pacific Sardine Reports 2011. Trinational Sardine Forum December 8-9, 2011 La Jolla, CA. Presented by Dale Sweetnam NOAA Fisheries, SWFSC Information compiled from 2011 annual reports submitted to the Pacific Fishery Management Council, November 2011.

E N D
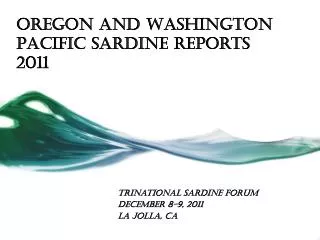
Oregon and Washington Pacific Sardine Reports 2011 Trinational Sardine Forum December 8-9, 2011 La Jolla, CA
Presented by Dale SweetnamNOAA Fisheries, SWFSCInformation compiled from 2011 annual reports submitted to the Pacific Fishery Management Council, November 2011 Oregon Department of Fish and Wildlife Greg Krutzikowsky (unable to attend) Jill Smith (unable to attend) Washington Department of Fish and Wildlife Lorna Wargo (unable to attend)
OR - Fishery WA - Fishery • Day fishery only • Processors mainly in Astoria • Monitored in real time • 25 Oregon Permits • Tides and/or weather are major factors • Pilots assist some fishery participants • Fishery opens annually April 1 • Processors mainly in Westport and Illwaco • 16 permanent WA permits, 9 temporary annual permits available • Tides and/or weather are major factors
OR – 11,023 metric tons in 2011 (directed fishery + EFP-aerial survey), maximum of 45,111 in 2005 • WA – 7,918 metric tons in 2011, maximum of 15,820 in 2002
OR – 17 vessels in 2011, maximum of 22 in 2007 and 2008; 25 permits available • WA – 7 vessels in 2011, maximum of 19 in 2002; 16 permanent permits, 9 temporary annual permits
OR – Range from 27.3 to 57.9 in 2011; 144 landings in 2011, maximum of 1090 in 2005 • WA – Range from 31.6 to 62.8 in 2011; 126 landings in 2011, maximum of 424 in 2002
OR – Value is $3.2 million in 2011, maximum value of 5.8 million in 2005; Price per pound $0.13 in 2001, ranged from $0.05 until 2008 when prices increased • WA – 2011 value is not reported yet in PacFIN, $2.6 million in 2010; Price per pound ranged from $0.04-0.06 until 2008 when price increased to $0.10 in 2010; 2000 and 2006 values not reported
Bycatch Information OR WA 2011 – 35 released alive, 37 released dead, 72 total (logbook) 2011 – 4.7 mt of Pacific mackerel
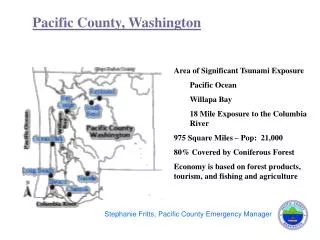
Quinault Tribal Allocation • Landings within the Usual and Accustomed (U & A) fishing area: • 47◦ 40.10’ N. latitude (Destruction Island) • 46◦ 53.30’ N latitude (Point Chehalis • East of 125◦ 44’ W longitude
Washington Licensed Sardine Purse Seine Set Locations from logbook data, 2008-2011; and the Quinault Indian Nation Usual and Accustomed (U&A) Fishing Grounds
Washington Licensed Sardine Purse Seine Set Locations from logbook data, 2008-2011; and the Quinault Indian Nation Usual and Accustomed (U&A) Fishing Grounds
Information compiled from 2011 annual reports submitted to the Pacific Fishery Management Council, November 2011 Questions?