Download
1 / 124
1.24k likes | 1.25k Views
Explore the fundamentals of functions and their graphs, including domain and range determination, function notation, vertical line test, and graph interpretations. Practice identifying relationships and equations as functions. Learn to find x and y-intercepts and evaluate functions. Discover how to identify intervals of function increase or decrease from graphs.

E N D
Aim #1.2: What are the basics of functions and their graphs? • Let’s Review: • What is the Cartesian Plane or Rectangular Coordinate Plans? • How do we find the x and y-intercepts of any function? • How do we interpret the viewing rectangle [-10,10, 1] by [-10, 10,1]?
IN THIS SECTION WE WILL LEARN: • How to find the domain and range? • Determine whether a relation is a function • Determine whether an equation represents a function • Evaluate a function • Graph functions by plotting points • Use the vertical line to identify functions
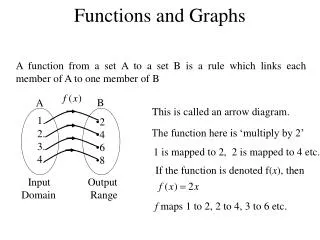
WHAT IS A RELATION? • A relation is a set of ordered pairs. • Example: (4,-2), (1, 2), (0, 1), (-2, 2) • Domain is the first number in the ordered pair. Example:(4,-2) • Range is the second number in the ordered pair. • Example: : (4,30)
EXAMPLE 1: • Find the domain and range of the relation. • {(Smith, 1.0006%), (Johnson, 0.810%), (Williams, 0.699%), (Brown, 0.621%)}
PRACTICE: • Find the domain and range of the following relation.
HOW DO WE DETERMINE IF A RELATION IS A FUNCTION? • A relation is a function if each domain only has ONE range value. • There are two ways to visually demonstrate if a relation is a function. • Mapping • Vertical Line Test
DETERMINE WHETHER THE RELATION IS A FUNCTION • {(1, 6), (2, 6), (3, 8), (4, 9)} • {(6, 1), (6, 2), (8, 3), (9, 4)}
FUNCTIONS AS EQUATIONS • Functions are usually given in terms of equations instead of ordered pairs. • Example: y =0.13x2 -0.21x + 8.7 • The variable x is known the independent variable and y is the dependent variable.
HOW DO WE DETERMINE IF AN EQUATION REPRESENTS A FUNCTION? • x2 + y = 4 • Steps: • Solve the equation for y in terms of x. • Note: • If two or more y values are found then the equation is not a function.
HOW DO WE DETERMINE IF AN EQUATION REPRESENTS A FUNCTION • x2 + y2 =4 • Steps: • Solve the equation for y in terms of x. • Note: • If two or more y values are found then the equation is not a function.
PRACTICE: • Solve each equation for y and then determine whether the equation defines y as a function of x. • 2x + y = 6 • x2 + y2 = 1
WHAT IS FUNCTION NOTATION? • We use the special notation f(x) which reads as f of x and represents the function at the number x. • Example: f (x) = 0.13x2 -0.21x +8.7 • If we are interested in finding f (30), we substitute in 30 for x to find the function at 30. • f (30)= 0.13(30)2 -0.21 (30) + 8.7 • Now let’s try to evaluate using our calculators.
HOW DO WE EVALUATE A FUNCTION? • F (x) = x2 + 3x + 5 • Evaluate each of the following: • f (2) • f (x + 3) • f (-x) • Substitute the 2 for x and evaluate. • Then repeat.
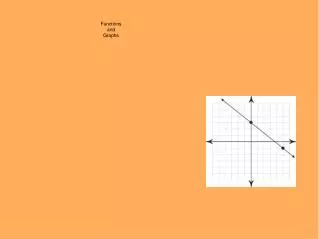
GRAPHS OF FUNCTIONS • The graph of a function is the graph of the ordered pairs. • Let’s graph: • f (x) = 2x • g (x) = 2x + 4
USING THE VERTICAL LINE TEST • The Vertical Line Test for Functions • If any vertical line intersects a graph in more than one point, the graph does not define y as a function of x.
Practice: Use the vertical line test to identify graphs in which y is a function of x.
SUMMARY: ANSWER IN COMPLETE SENTENCES. • What is a relation? • What is a function? • How can you determine if a relation is a function? • How can you determine if an equation in x and y defines y as a function of x? Give an example.
AIM #1.2B: WHAT KIND OF INFORMATION CAN WE OBTAIN FROM GRAPHS OF FUNCTIONS? • Note the closed dot indicates the graph does not extend from this point and its part of the graph. • Open dot indicates that the point does not extend and the point is not part of the graph.
HOW DO WE IDENTIFY DOMAIN AND RANGE FROM A FUNCTION’S GRAPH? • Domain: set of inputs Found on x –axis Range: set of outputs Found on y -axis
Using set builder notation it would look like this for the domain: • Using Interval Notation: [-4, 2] • What would it look like for the range using both set builder and interval notation?
Use Set Builder Notation. Domain: Range: IDENTIFY THE DOMAIN AND RANGE OF A FUNCTION FROM ITS GRAPH
IDENTIFYING INTERCEPTS FROM A FUNCTION’S GRAPH • We can say that -2, 3, and 5 are the zeros of the function. The zeros of the function are the x- values that make f (x) = 0. Therefore, the real zeros are the x-intercepts. A function can have more than one x-intercept, but at most one y-intercept.
SUMMARY: ANSWER IN COMPLETE SENTENCES. • Explain how the vertical line test is used to determine whether a graph is a function. • Explain how to determine the domain and range of a function from its graph. • Does it make sense? Explain your reasoning. I graphed a function showing how paid vacation days depend on the number of years a person works for a company. The domain was the number of paid vacation days.
AIM #1.3: HOW DO WE IDENTIFY INTERVALS ON WHICH A FUNCTION IS INCREASING OR DECREASING? • Increasing, Decreasing and Constant Functions • A function is increasing on a open interval, I if f (x1) < f(x2) whenever x1<x2 for any x1 and x2 in the interval.
A function is decreasing on an open interval, I, if f(x1) > f (x2) whenever x1 > x2 for any x1 and x2 in the interval.
A function is constant on an open interval, I, f(x1) = f (x2) for any x1 and x2 in the interval.
Note: • The open intervals describing where function increase, decrease or are constant use x-coordinates and not y-coordinates.
Example 1: Increases, Decreases or Constant State the interval where the function is increasing, decreasing or constant.
Practice: State the interval where the function is increasing, decreasing or constant.
WHAT IS A RELATIVE MAXIMA? • Definition of a Relative Maximum A function value f (a) is a relative maximum of f if there exists an open interval containing a such that f (a) > f (x) for all x ≠ a in the open interval.
WHAT IS A RELATIVE MINIMA? • Definition of a Relative Minimum • A function value f (b) is a relative minimum of f if there exists an open interval containing b such that f (b) < f (x) for all x ≠ b in the open interval.
HOW DO WE IDENTIFY EVEN AND ODD FUNCTIONS AND SYMMETRY? • Definition of Even and Odd Functions The function f is an even function if f (-x)= f (x) all x in the domain of f. The right side of the equation of an even function does not change if x is replaced with –x. The function f is an odd function if f (-x) = -f (x) for all x in the domain of f. Every term on the right side of the equation of an odd function changes its sign if x is replaced with –x.
DETERMINE IF FUNCTION IS EVEN,ODD OR NEITHER • f (x) = x3 - 6x • Steps: • Replace x with –x and simplify. • If the right side of the equation stays the same it is an even function. • If every term on the right side changes sign, then the function is odd.
DETERMINE IF FUNCTION IS EVEN, ODD OR NEITHER • g (x) = x4 - 2x2 • h(x) = x2 + 2 x + 1 • Steps: • Replace x with –x and simplify. • If the right side of the equation stays the same it is an even function. • If every term on the right side changes sign, then the function is odd.
PRACTICE: • Determine if function is Even, Odd or Neither • f (x) = x2 + 6 • g(x) = 7x3 – x • h (x) = x5 + 1
The function on the left is even. • What does that mean in terms of the graph of the function? • The graph is symmetric with respect to the y-axis. For every point (x, y) on the graph, the point (-x, y) is also on the graph. • All even functions have graphs with this kind of symmetry.
The graph of function f (x) = x3 is odd. • It may not be symmetrical with respect to the y-axis. It does have symmetry in another way. • Can you identify how?
For each point (x, y) there is a point (-x, -y) is also on the graph. • Ex. (2, 8) and (-2, -8) are on the graph. • The graph is symmetrical with respect to the origin. • All ODD functions have graphs with origin symmetry.
SUMMARY:ANSWER IN COMPLETE SENTENCES. • What does it mean if a function f is increasing on an interval? • If you are given a function’s equation, how do you determine if the function is even, odd or neither? • Determine whether each function is even, odd or neither. a. f (x) = x2- x4 b. f (x) = x(1- x2)1/2
AIM #1.3B: HOW DO WE UNDERSTAND AND USE PIECEWISE FUNCTIONS? • A piecewise function is a function that is defined by two (or more) equations over a specified domain.
Example: ( DO NOTCOPY) READ • A cellular phone company offers the following plan: • $20 per month buys 60 minutes • Additional time costs $0.40 per minute
PRACTICE: • Find and interpret each of the following: a. C (40) b. C (80)
We can use the graph of a piecewise function to find the range of f. • What would the range be for the piecewise function? ( For previous piecewise function)
Some piecewise functions are called step functions because the graphs form discontinuous steps. • One such function is called the greatest integer function, symbolized by int (x) or • int (x) = greatest integer that is less than or equal to x. • For example: a. int (1) = 1, int (1.3) = 1, int (1.5) = 1, int (1.9)= 1 b. int (2) = 2, , int (2.3) =2 , int (2.5) = 2, int (2.9)= 2
FUNCTION AND DIFFERENCE QUOTIENTS • Definition of the Difference Quotient of a Function: The expression for h≠0 is called the difference quotient of the function f.