Download
1 / 24
250 likes | 440 Views
Radioactive Equilibrium: 99 Mo/ 99m Tc Valery Chechev V.G. Khlopin Radium Institute, 194021 Saint Petersburg, Russia Second Workshop for Radioactive Decay Data Evaluators: Training Sessions of the Decay Data Evaluation Project (DDEP-2008) 12 – 14 May 2008, IFIN-HH, Bucharest.

E N D
Radioactive Equilibrium: 99Mo/99mTc Valery Chechev V.G. Khlopin Radium Institute, 194021 Saint Petersburg, Russia Second Workshop for Radioactive Decay Data Evaluators: Training Sessions of the Decay Data Evaluation Project (DDEP-2008) 12 – 14 May 2008, IFIN-HH, Bucharest
GENERAL REMARKS Radioactive equilibrium of two (or more) radionuclides composing a radioactive series is achieved when the half-life of the daughter (T2) is shorter than that of the parent (T1): T2 T1 . A ratio of the daughter and parent activities is described by the formula A2/A1 = [T1/(T1T2)] {1exp[0.693(1/T2 1/T1)t]} where the time t=0 corresponds to a pure parent radionuclide.In equilibrium a ratio of number of daughter atoms to that of parent atoms as well as a ratio of their activities is approximately constant: A2/A1 [T1/(T1T2)]. Generally, equilibrium is considered to be established after 10T2. For an equilibrium mixture of radionuclides all absolute intensity values are given usually per 100 disintegrations oftheparent nuclide. This rule is applied alsoif the daughter is an isomer (e.g. 95Zr/95mNb, 99Mo/99mTc, 125Sb/125mTe).
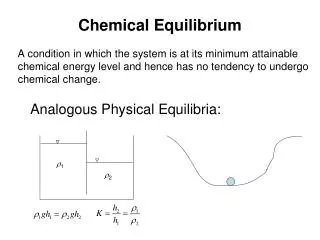
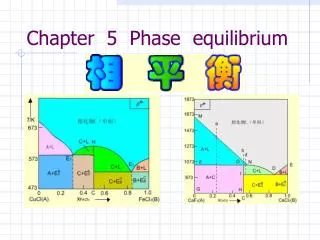
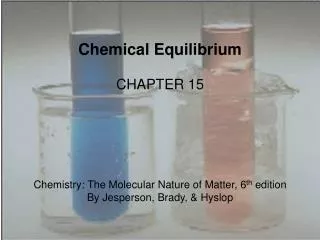
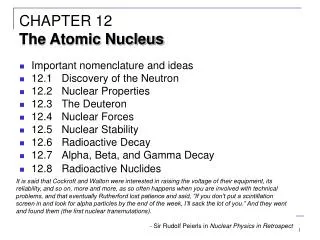
RADIOACTIVE EQUILIBRIUM WITH ISOMER For the equilibrium mixture of the parent radionuclide and daughter isomer (t10T2), the emission probabilities for isomer transitions are P(i) + P(cei) = [T1/(T1T2)] Pi , where Piis the isomeric transition probability. In this report, as example of radioactive equilibrium with isomer, the evaluation of 99Mo/99mTc decay data done jointly by researchers of LNHB and KRI in 2000 is examined. For users it is of interest of decay data both for the equilibrium mixture of 99Mo/99mTc and pure 99mTc. Therefore, both evaluations are presented on the DDEP web site. Here only the equilibrium 99Mo/99mTc decay data is considered. I do not concern the evaluation of proper 99mTc decay data done on usual DDEP procedures for separateradionuclide in 2000 (Fig. 1). (The half-life of 99mTc was updated in 2004).
1/2– 142.681 7/2+ 140.511 β– 0.004% (5/2+) 322.4 9/2+ β– 3/2+ 89.8 5/2+ 0 stable Fig. 1
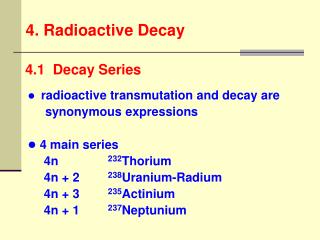
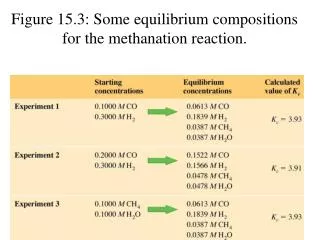
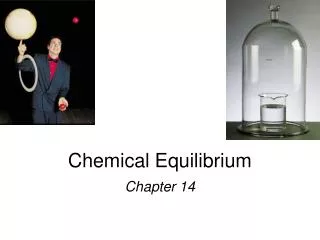
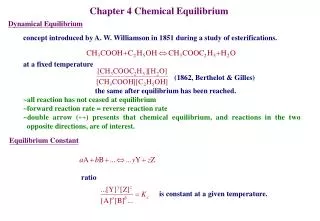
66 h 99Mo 960.8 823.0 Other Levels 777.9 739.5 411.5 1/2+ 920.6 366.4 3/2¯ 509.1 181.1 40.6 5/2+ 181.1 142.7 2.17 1/2¯ 142.7 140.5 6.0 h 7/2+ 140.5 9/2+ 0 Fig. 2 99Tc
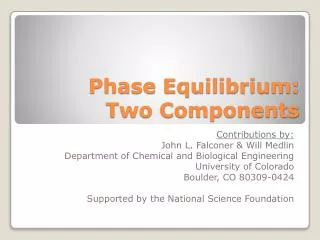
99Mo with a half-life of 66 hours disintegrates to the 99Tc excited levels by transitions. About 88% decays of 99Mo occur to the 142.7 keV level (99Tc isomer) which has a half-life of 6 hours. The basic lines of the 99Mo decay were determined as long ago as in the middle of the last century and later on they were confirmed and worked out in details. The latest experimental work devoted to a detailed analysis of the 99Mo decay scheme was published by Goswamy et al. (1992Go22). Subsequent NDS evaluations by Peker (1994Pe15) and by Tuli et al. (2001Tu04) as well as the DDEP one (2000) are based mainly on the decay scheme from Goswamy et al. For 99Mo/99mTc equilibrium the factor T1/(T1T2) is equal 1.1005(8). It should be taken into account in the equilibrium intensitiesof the isomeric142.7 keV -rayanda “slow” componentof the140.5 keV -raywhich are concerned with the 99mTc decay (Fig.2).The contribution of a “prompt” component (5%) is conditioned mainly by the intensity of the -transition 40.6 keV.
RELATIVE EMISSION PROBABILITIES OF GAMMA RAYS The results of measurements of relative -ray emission probabilities along with ICC are key experimental data for obtaining a set of evaluated 99Mo/99mTc decay characteristics. In the DDEP evaluation (Morillon et al., 2000) the739.5 keV -ray has been taken as the reference one because it is not a part of the isomer 99mTc decay scheme (in contrast to the 140.5 keV -ray), and also, because most of measurements was done relatively to the 739.5 keV -ray. In Table 1 the available experimental values for the -ray relative emission probabilities are given. Where necessary, these data (including uncertainties) have been corrected by the evaluators to the values in units of 100 to the 739.5 keV -ray relative emission probability. In the last columns of Table 1 the evaluated values are displayed. References are given using the NSR keynumbers and can be found on the DDEP web site.
66 h 99Mo 960.8 823.0 Other Levels 777.9 739.5 411.5 1/2+ 920.6 366.4 3/2¯ 509.1 181.1 40.6 5/2+ 181.1 142.7 2.17 1/2¯ 142.7 140.5 6.0 h 7/2+ 140.5 9/2+ 0 Fig. 2 99Tc
Table 1. Experimental and evaluated relative emission probabilities of most intense -rays from the 99Mo/99mTc equilibrium mixture decay Rindicates that the value has been omitted as outlier
Here in Table 1* the results are shown for 16 most intense -rays of 32.The evaluated values-2000 are given in the third column from the right edge of the table. I have revisedthese results taking into account the new measurements of Lashko (2003La27) for -rays with energy more than 150 keV.Besides, new statistical processing was done with the LWEIGHT computer program (instead of the EV1NEW program used previously). The uncertainty assigned in this evaluation to the recommended value is always greater than or equal to the smallest uncertainty in any of the experimental values used in the statistical processing. The new evaluated values are given in the last column. They differ slightly from the evaluation results-2000. * Additionally for convenience in Table1 it is not shown the single measurement result of Yang et al. (1980) and two ones of Chen Da et al. (1980) which were taken into account in statistical processing.
INTERNAL CONVERSION COEFFICIENTS (ICC) In the DDEP evaluation-2000 most of ICC was adopted from tables of Rösel et al. (1978)in the issue of analysis and averaging available results of measurements of ICC and multipolarity mixing ratios. For pure multipolarities the relative uncertainties of ICC were adopted to be 2%. In case of mixed multipolarities the uncertainties of ICC were evaluated taking into account the uncertainties on the respective multipolarity admixture coefficients. Not changing the results of analysis-2000 of the available experimental data I have obtained BRICC values for the same gamma transitions and their multipolarities. Below the evaluation results are given for ICC (TandK) of the basic low energy gamma transitions in comparison with the BRICC values obtained currently.BRICC valuesvary from those ofRösel et al. (1978) in limits of the adopted ICC uncertainty of 2%.
Transition 40.6 keV * Hereinafter “Adopted” concerns to the DDEP evaluation-2000
Transition 142.7 keV Internal Conversion Coefficient T For M4 the theoretical value from Rösel is 40.9(8)[BRICC: 40.2(8)]. Internal Conversion Coefficient K The theoretical K conversion coefficient, for M4, is 29.3(6)(Rosel et al.)[BRICC: 29.1(6)]. Transition 181.1 keV Internal Conversion Coefficients T 0.140(5) DICKENS and LOVE (1980) GARDULSKI and WIENBECK (1974) measured a low mixing ratio of 0.002(7) for M3/E2 multipolarity. For E2, the theoretical value is 0.149(3) (Rosel et al.)[BRICC: 0.148(3)]
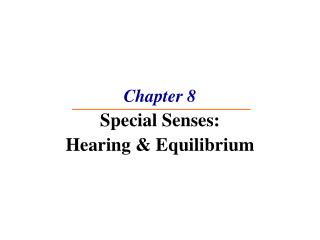
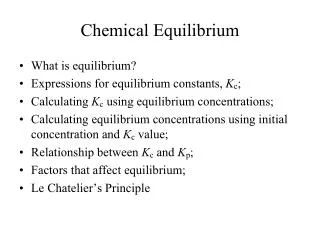
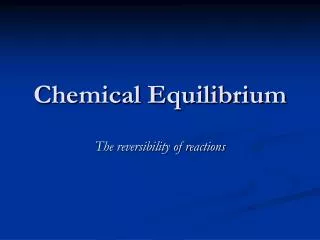
NORMALIZATION FACTOR A normalization factor (N) for obtaining absolute -ray emission probabilities P() per disintegration of 99Mo can be deduced by three ways: 1).From the(+ce)-intensity balance to the ground state of 99Tcusing the decay scheme (Fig. 2, 3) and evaluated total ICC. As above said already, in this calculation we should take into accountthe factor [T1/(T1T2)] = 1.10 in the equilibrium intensities of the 142.7 keV -ray and a “slow” component of the 140.5 keV -raywhich are concerned with the 99mTc decay. The “prompt” componentof the 140.5 keV -ray is conditioned mainly by the intensity of the -transition 40.6 keV and can be deduced accurately from the sum intensity of -transitions populated the level 140.5 keV with the exception of the 2.17 keV -transition in 99mTc: It (“prompt” 140.5 keV) = It (40.6 keV) + It (621.8 keV) + It (1001 keV) = 43.6(15) in relative units of Table 1. From here I (“prompt” 140.5 keV) =39.3(12). Using the evaluated equilibrium intensity of 744(11), we obtain 705(11)for the “slow” component of the140.5 keV -ray intensity. [Here ItI (+ce) = I (1+T)]. Thus we have for the intensity balance to the ground state of 99Tc: 100% disintegrations of 99Mo = It (“prompt” 140.5 keV) + [It (“slow” 140.5 keV) / 1.10] + [It (142.7 keV) / 1.10] + It (181.1 keV) + It (761.8 keV) + It (1072 keV) = 824(13). From here N = 0.1214(19)%andP( 739.5 keV) = 12.14(19)%.
1/2+ (3/2¯) 1198.9 3/2+ 1172.0 3/2+ 1141.87 (3/2)¯ 1129.12 (7/2+) 1072.2 3/2(¯) 1004.07 1/2+ 920.59 5/2+ 761.7 3/2¯ 671.49 (3/2+) 534.4 3/2¯ 509.11 5/2+ 181.094 1/2¯ 142.683 7/2+ 140.511 0 Fig. 3 9/2+
2). From thesum of probabilities of all the beta transitions leaving 99Mothat must be equal to 100 %. The probabilities of --transitions have been obtained from the P(+ce) balance at each level in the same relative units of Table 1. Balance at the level 142.7 keV: I( 1214 keV) = {[It (2.17 keV) + It(142.7 keV)] / 1.10} It ( input) = 677(11). Here, for evaluation of the total intensity of the low energy transition 2.17 keV, the intensity balance for the level 140.5 keV was used. The -transition to this level is negligible due to a great forbiddenness. Balance at the level 140.5 keV: It (2.17 keV) = It (140.5 keV) It (40.6 keV) It (621.8 keV) It (1001 keV) = 788(13). Balance at the level 181.1 keV leads to the negligible intensity of the -transition to this level, 1.7(17), in relative units of Table 1. Similar evaluations for higher levels have led to the -transition intensities as follows: I ( 848 keV) = 9.69(15), I ( 823 keV) = 0.008(5), I (686 keV) = 0.423(17), I (437 keV) = 135.8(5), I (353 keV) = 1.12(2), I (285 keV) = 0.015(4), I (228 keV) = 0.090(5), I (215 keV) = 0.91(2), I (185 keV) = 0.013(3), I (158 keV) = 0.016(3). Thus 100% disintegrations of 99Mo = 825(12). From here N = 0.1212(17)% and P ( 739.5 keV) = 12.12(17)%.
3).From the measured directly absolute emission probability of the 739.5 keV -ray. Absolute measurements : number of photons per 100 decays 12.3 (3) A. Simonits - 1981 (Ge(Li)) 11.9 (3) Chen Da - 1985 (Ge(Li)) 12.00 (33) R.A. Meyer - 1990 (HPGe, Ge(Li)) The LWEIGHT computer program has used a weighted average and an internal uncertainty. Reduced 2 = 0.45. Evaluated absolute 739.5 keV emission probability:12,12(15)% and N = 0.1212(15)%. This value obtained from the above experimental data was adopted in the DDEP evaluation (2000) as recommended. As seen it agrees very well with the values deduced currently from intensity balances based on the adopted 99Mo decay scheme and new evaluated equilibrium -ray intensities from Table 1: 0.1214(19) and 0.1212(17). Using the relative intensities from Table 1 and the normalization factor N = 0.1212(15), the absolute emission probabilities (number of photons per 100 disintegrations of99Mo ) of all -rays from the 99Mo/99mTc equilibrium mixture decay have been deduced.
GAMMA RAYTRANSITION PROBABILITIESAND ABSOLUTE X-RAY AND ELECTRON EMISSION PROBABILITIES Using the evaluated absolute -ray emission probabilities and total ICC, the probabilities of all gamma ray transitions (except 2.17 keV transition) have been deduced for the 99Mo/99mTc equilibrium mixture. The probability of the 2.17 keV transition has been deduced from the intensity balance at the level 140.5 keV (see above). Using the evaluated ICC for K-, L- shells, the conversion electron emission probabilities have been deduced and with adopted atomic data the Tc KX-, LX- ray emission probabilities have been obtained.It should be noted that the emission probabilities of conversion electrons from the 142.7 keV isomeric transition and “slow” component of the 140.5 keV transition are increased for equilibrium mixture by factor of 1.10. Below the measured values of the total absolute emission probability of Tc KX-rays (100) are compared to the adopted value calculated using the EMISSION computer program:
Using the P(+ce) balance at each level (see above) and the normalization factor N = 0.1212(15), the probabilities of all -transitions in the 99Mo decay have been obtained.The -transitions to the ground state and level 140 keV have a high degree of forbiddenness and they are unobserved. Below the measured energies and probabilities of some - transitions are given for comparison with the evaluated ones:
HALF-LIFEOf 99MO (Updated In 2004) The measured half-life values are given, in hours, below:
Looking at the graphical representation given above, it appears that 5 high values are 66.5 hours, 10 values are in the range about 66.0 h and 2 low values are 65.6 h. The value of 1983Wa26 given by Walz et al. was superseded in 2003 by Schrader. When processing the 17 remained values, the LWEIGHT computer program has detected 1957Wr37, 1958Pr71, 1961Ne15, 1965Cr03, 1968Re04, 1971Ba28, 1979Di07 and 2 values of Butsev et al. (65.85(10) and 64.92(25)) to be outliers, based on Chauvenet’s criterion. The Limited Relative Statistical Weight method increases the uncertainty for the 1980Ho17 value from 0.003 to 0.00481 and the LWEIGHT program chooses the unweighted mean of 65.983(38) with the large uncertainty that does not correspond to the most accurate measured values (1980Ho17, 1982HoZJ or 1992Un01 and 2003Sc49). With the set of the 5 most recent values (1972Em01, 1980Ho17, 1982HoZJ or 1992Un01, 1998Bu01 and 2003Sc49), the Limited Relative Statistical Weight method increases the uncertainty for the 1980Ho17 value from 0.003 to 0.00482 and the LWEIGHT program has used the weighted mean of 65.949(14), 0.014 is the external uncertainty, the reduced-2 is 10.4. The adopted value is 65.949(14) h or 2.7479(6) d.
CONCLUSION All things considered, I show the table of revised (updated) evaluated data for basic gamma ray emissions and transitions in comparison with the evaluations-2000. Table 2. Evaluated data for basic gamma ray emissions and transitions from the 99Mo/99mTc equilibrium mixture decay Evaluation-2000 – by red, revised (updated) evaluation-2008 – by blue. The revision leads to small changes in the evaluated values improving their consistency in the network of intensity balance correlations of 99Mo decay scheme. *Note: P(tr.) is not equalP() (1+T) for these equilibrium -rays.