Download
1 / 18
180 likes | 296 Views
This report details an innovative approach to digitization at the MicroBooNE detector, focusing on the need to improve the digitization design to effectively reduce noise contamination. It introduces a TDC FPGA-based design that enables the direct feeding of analog signals, enhancing efficiency in data processing. The performance tests demonstrate the ability to achieve high precision (70 ps) in hit time measurements, which are crucial for reconstructing signals. Calibration methods and results are discussed, showcasing improvements over traditional methods and guiding future detector development.

E N D
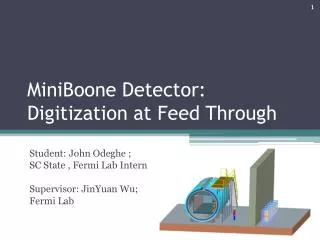
MiniBoone Detector: Digitization at Feed Through Student: John Odeghe ; SC State , Fermi Lab Intern Supervisor: JinYuan Wu; Fermi Lab
Outline • Mini Boone Detector • The need for changing digitization design • Digitization at Feed through • The TDC FPGA Design • Performance Tests and Results • Conclusions
General Description • MicroBooNE detector: • 150 tons total Liquid Argon • 89 tons active volume • TPC: ~2.5 x 2.3 x 10.4m long • Ionization electrons drift to beam right • 30 PMTs peek through the wire chambers on beam right • Will use BNB and NuMI beams at FNAL for physics program MicroBooNE LAr TPC Development Goals • Demonstrate photon – electron identification • Develop cold electronics • Implementation of cold electronics in Gaseous Argon (GAr) • Purity: Test of GAr purge in large, fully instrumented vessel • Refine sensitivity estimates for next generation detectors • Test ability to run on surface • Develop tools for analysis • Develop cost scaling model for larger detectors
General Description: LArTPCs • Passing charged particles ionize Argon • Electric fields drift electrons meter to wire chamber planes • Induction/Collection planes image charge, record dE/dx
Readout channel information flow Source: MicroBooNE Conceptual Design Report , Feb 2010 • Short Falls of current Design • Poor Noise Handing • Limited cable Run
Digitization at Feed Through • The goal is to digitize the analog signals before they are contaminated by noise. • However, digitization processes create noise that may contaminate signals. • Therefore, it is a natural to minimize digital activities in the digitization processes. • Q: How many bit transitions are considered to be minimal? A: 1 bit transition/data sample.
FPGA AMP & Shaper ADC AMP & Shaper ADC AMP & Shaper ADC AMP & Shaper ADC FPGA AMP & Shaper TDC AMP & Shaper TDC AMP & Shaper TDC AMP & Shaper TDC VREF R1 R1 C R2 V1 V2 V3 V4 T1 T2 T3 T4 Single Slope TDC The current design consist of ADC feeding digitized data to the FPGA for analysis. But we can Implement a TDC on an FPGA. This allows us to directly feed analog signals to the FPGA, eliminating extra ADC hardware. This scheme proves even more efficient in digitization. RC circuit creates Ramping reference voltage, which is compared with analog signals in FPGA. Hit time is measured to a high precision. Signals can be reconstructed using the hit times. • Quick Facts on our TDC FPGA • Implemented on Altera Cyclone FPGA • Primary firmware employs delay chains to determine transition time • Wave Union launcher is implemented to ameliorate ultra wide bins effect • TDC can run to a precision of 70 ps (LSB)
Fast TDC Card TDC FPGA
Performance Tests • Oscilloscope pictures • Optimized range common mode signals • Calibration • Test Signals • Histograms
Tests Start with analyzing critical signals • Using a scope we can check the differential ramping signals. • The ramping RC signals are derived from clocking signals in the board • The ramping signal serves as a sampling signal (in pic. 3 a slower ramp is sampled) Oscilloscope Pictures Pic. 1 Ramping signals (1MHz) Pic. 3 Sampling using the ramping Signals Pic. 2 Ramping signals generated from clock.
Common mode Signals • Device is designed for differential Input Signals • Performance can be compromised owing to offset of input • signal. • We can investigate this behavior by feeding common • mode signals • Observe that optimization is attained within the described • range optimized Time (ns) optimized Time (ns) Voltage Offset (V) Voltage Offset (V)
Calibration • Check for accuracy of device • by matching measured • samples with calculated • curve • Generate a lookup table for • time conversions • Understand slight • aberrations • Moving forward in data • interpretation Calculated Measured Ramping Up Measured Ramping Dwn Voltage (v) Time (ns)
Test Signal • A pulse signal is fed to an input channel • Controlling the TDC through a serial port, the signal is sampled • Raw data from the sampling is saved to a remote computer • The goal is to recreate the signal using the array of hit time sampled • With the calibration formula obtained we can regenerate input signals • Ramping up and ramping down samples are converted and plotted in the same graph • Notice that both signal samples match Amplitude (v)
Histograms plot bins on the LSB of Hit Time • It’s a pictorial evaluation of precision of the TDC. • With a constant amplitude signal, we expect a sharp pic and little variance • Channel 7 is supplied with a constant amplitude signal. • Histograms of both ramping up and ramping down samples confirms our prediction Histograms
Histograms • A varying amplitude like the pulse signal will be interesting to analyze on a histogram. • Observe the noticeable peak and the smaller bumps. Amplitude (v)
Acknowledgment • Fellow SIST Interns • SIST Committee • 14th floor WH PPD crew