Download
1 / 31
320 likes | 518 Views
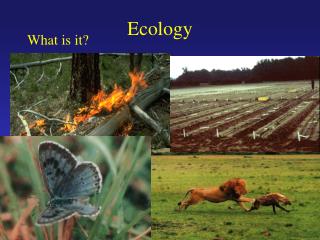
Ecology. ECOLOGY. *ECOLOGY is the scientific study of interactions between organisms and their environment or ecosystem - reveals inter-relationships between living and nonliving parts of the world. *The Organization of Life.

E N D
ECOLOGY • *ECOLOGY is the scientific study of interactions between organisms and theirenvironment or ecosystem - reveals inter-relationships between living and nonliving parts of the world
*The Organization of Life • INDIVIDUAL – oneorganism that can breed and produce fertile offspring • POPULATIONS - group of individuals that belong to thesame species, live in the same place and interbreed.
The Organization of Life • COMMUNITIES - collection of interacting populations in one area. • ECOSYSTEMS - the interactions among populations in a community (biotic factors) & the community’s physical surroundings (abiotic factors)
The Organization of Life • BIOME – large areas with same climate and dominantcommunity • BIOSPHERE – the entire planet and all its living and nonliving parts.
Figure 3-2 Ecological Levels of Organization Figure 3-2 Ecological Levels of Organization Section 3-1 http://www.youtube.com/watch?v=cWh-XKhh8xo
*What do you think? • Can a group of rabbits and a group of mice be in the same population? Why? • Can a group of grey squirrels and red squirrels be in the same population? Why? • Can the groups of rabbits, squirrels and mice be in the same community? Why?
What do you think? • No, not the same species. • No, They are not the same species. • Yes, assembly of different population in a defined area.
Population & Community • Glue picture on one half of the page. • Draw images of populations that could live in that habitat on the same half of the page. • Copy and complete the chart below on the other half of the page.
AUTOTROPHS • Organisms that use energy from the sun or energy stored in chemical compounds to make food - also called PRODUCERS (autotrophs = do photosynthesis)
*HETEROTROPHS • Organisms that depend on autotrophs as their source of nutrients & energy = CONSUMERS: • HERBIVORES - plant-eaters • CARNIVORES - meat-eaters • OMNIVORES- eat plants and animals • SCAVENGERS - feed on dead animals • DECOMPOSERS –break down dead organisms
Matter and energy are constantly cycling through stable ecosystems • *FOOD CHAIN - simple model scientists use to show how matter & energy move through an ecosystem - typical chains are three to four links long • http://science.howstuffworks.com/life/27997-assignment-discovery-the-food-web-video.htm
*Simple food chain C____________ Types of Consumers C____________ H_________ P____________
*FOOD WEB Expresses all the possible feeding relationships at each trophic level in a community
Food Web Section 3-2
http://studyjams.scholastic.com/studyjams/jams/science/ecosystems/food-webs.htmhttp://studyjams.scholastic.com/studyjams/jams/science/ecosystems/food-webs.htm
TROPHIC LEVELS • Trophic levels are feeding steps: • 3rd Order tertiary Consumers - carnivores that feed on 2nd order consumers • 2nd Order Secondary Consumers – carnivores • 1st Order Primary Consumers – herbivores • 1st Trophic LevelPrimary Producers – made up of autotrophs and producers
ECOLOGICAL PYRAMID • Used to depict energy conversions in an ecosystem • Source of all energy - sun! • About 10% of this energy used for life processes; rest lost as heat. Energy available for life processes in % 0.1% 1.0% 10% 100%
Create a Food Web • Pick an ecosystem: savannah, rainforest, deciduous forest, tundra, prarie etc. • Pick a top predator and make a food chain • Add to the food chain with other animals for that ecosystem to turn the food chain into a food web. • Present your food web.
Evaporation Transpiration *The Water Cycle (pg 75) Section 3-3 Condensation Precipitation Runoff Seepage Root Uptake
*Figure 3-13 The Carbon Cycle (pg 77) Section 3-3 CO2 in Atmosphere CO2 in Ocean
*Figure 3-14 The Nitrogen Cycle (pg 78) Section 3-3 N2 in Atmosphere NO3- and NO2- NH3
Name the Consumers Write three paragraphs describing the video in terms of trophic levels. Use the following terms in your iNB output page: INDIVIDUAL PRIMARY CONSUMER POPULATIONS SECONDARY CONSUMER COMMUNITIES ECOSYSTEMS BIOME http://video.nationalgeographic.com/video/animals/amphibians-animals/frogs-and-toads/frog_greentree_lifecycle/
Go Online Internet • The latest discoveries in preserving the environment • Links from the authors on exploring ecology from space • Interactive test • For links on energy pyramids, go to www.SciLinks.org and enter the Web Code as follows: cbn-2032. • For links on cycles of matter, go to www.SciLinks.org and enter the Web Code as follows: cbn-2033.
Interest Grabber Accountable Team Tasts Energy flows in one direction through an ecosystem, from the sun or inorganic compounds to producers (organisms that can make their own food) through various levels to consumers (organisms that rely on other organisms for food). Your body gets the energy and materials it needs for growth and repair from the foods you eat. Complete the following in iNB output page (you may need to make a flip chart). • Draw pictures of the foods you like to eat. Indicate whether the food comes from a producer or consumer and label each as an autotroph or heterotroph. • Put the pictures in a food web showing how your favorite foods obtains energy. Include at least three levels. • Compare your food web to the students in your table team.
Accountable Team Task Cont… • Now as a table team create a food web poster using all of the foods from your table team. Student A – energy flow Student B – producers Student C – Consumers Student D – primary, secondary, or tertiary
Ecological Pyramids Ecological Pyramids Section 3-2 Energy Pyramid Shows the relative amount of energy available at each trophic level. Organisms use about 10 percent of this energy for life processes. The rest is lost as heat. Pyramid of Numbers Shows the relative number of individual organisms at each trophic level. Biomass Pyramid Represents the amount of living organic matter at each trophic level. Typically, the greatest biomass is at the base of the pyramid.
Minimums for Presentation on Food Webs (44 pts): 7 slides (2 pts ea) 4 pictures (2 pts ea) 6 vocab terms (2 pts ea) Prezi, Ppt, or Animoto Each student must have a speaking point (10 personal points – correct info 7 pts, speaking voice and attention 3 pts) 3 min TASKS: Proj Manager – Oversees the project has all criteria and all students are working together. Art Director – Pictures are appropriate for presentation and add to understanding Vocab Specialist – Presentation has at least 6 & are correct Information Coordinator – Concepts are correct and are organized to aid understanding