Download
1 / 1
10 likes | 143 Views
3D CTM Study of Arctic Ozone Loss and Denitrification Effect Wuhu Feng 1 , Martyn Chipperfield 1 , Stewart Davies 1 , V.L. Harvey 2 , C.E. Randall 2 1. School of Earth and Environment, University of Leeds, U.K 2. LASP, University of Colorado, Boulder, USA fengwh@env.leeds.ac.uk.

E N D
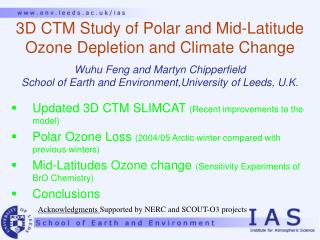
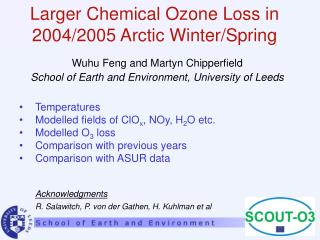
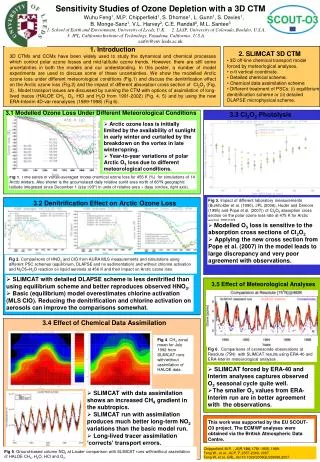
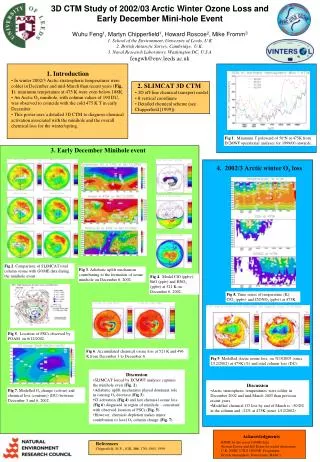
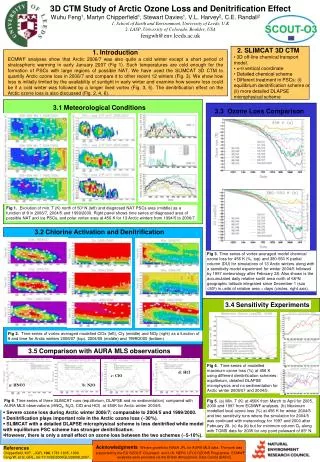
3D CTM Study of Arctic Ozone Loss and Denitrification Effect Wuhu Feng1, Martyn Chipperfield1, Stewart Davies1, V.L. Harvey2, C.E. Randall2 1. School of Earth and Environment, University of Leeds, U.K 2. LASP, University of Colorado, Boulder, USA fengwh@env.leeds.ac.uk 1. Introduction ECMWF analyses show that Arctic 2006/7 was also quite a cold winter except a short period of stratospheric warming in early January 2007 (Fig 1). Such temperatures are cold enough for the formation of PSCs with large regions of possible NAT. We have used the SLIMCAT 3D CTM to quantify Arctic ozone loss in 2006/7 and compare it to other recent 12 winters (Fig. 3). We show how loss is initially limited by the availability of sunlight in early winter and examine how severe loss could be if a cold winter was followed by a longer lived vortex (Fig. 3, 5). The denitrification effect on the Arctic ozone loss is also discussed (Fig. 2, 4, 6). 2. SLIMCAT 3D CTM • 3D off-line chemical transport model. • - vertical coordinate • Detailed chemical scheme • Different treatment in PSCs: (i) equilibrium denitrification scheme or (ii) more detailed DLAPSE microphysical scheme 3.1 Meteorological Conditions 3.3 Ozone Loss Comparison Fig 1. Evolution of min. T (K) north of 50o N (left) and diagnosed NAT PSCs area (middle) as a function of θ in 2006/7, 2004/5 and 1999/2000. Right panel shows time series of diagnosed area of possible NAT and ice PSCs, and polar vortex area at 456 K for 13 Arctic winters from 1994/5 to 2006/7. 3.2 Chlorine Activation and Denitrification Fig 3. Time series of vortex-averaged model chemical ozone loss for 456 K (%, top) and 380-550 K partial column (DU) for simulations of 13 Arctic winters along with a sensitivity model experiment for winter 2004/5 followed by 1997 meteorology after February 28. Also shown is the accumulated daily relative sunlit area north of 66oN geographic latitude integrated since December 1 (sza 93o) in units of relative area days (circles, right axis). 3.4 Sensitivity Experiments Fig 2. Time series of vortex averaged modelled ClOx (left), Cly (middle) and NOy (right) as a function of θ and time for Arctic winters 2006/07 (top), 2004/05 (middle) and 1999/2000 (bottom). 3.5 Comparison with AURA MLS observations Fig 4. Time series of modelled maximum ozone loss (%) at 456 K using different denitrification schemes: equilibrium, detailed DLAPSE microphysics and no sedimentation for Arctic winter 2006/07 and 2004/5. d: HCl c: ClO a: HNO3 b: N2O Fig 6. Time series of three SLIMCAT runs (equilibrium, DLAPSE and no sedimentation) compared with AURA MLS observations (HNO3, N2O, ClO and HCl) at 450K for Arctic winter 2004/5. Fig 5. (a) Min. T (K) at 456K from March to April for 2005, 2000 and 1997 from ECMWF analyses. (b) Maximum modelled local ozone loss (%) at 456 K for winter 2004/5 and two sensitivity runs where the simulation for 2004/5 was continued with meteorology for 1997 and 2000 after February 28. (c) As (b) but for minimum column O3 along with TOMS data for 2005 for any point poleward of 65o N. • Severe ozone loss during Arctic winter 2006/7; comparable to 2004/5 and 1999/2000. • Denitrification plays important role in the Arctic ozone loss (~30%). • SLIMCAT with a detailed DLAPSE microphysical scheme is less denitrified while model with equilibrium PSC scheme has stronger denitrification. • However, there is only a small effect on ozone loss between the two schemes (~5-10%). AcknowledgmentsWe are grateful to NASA JPL for AURA MLS data. The work was supported by the EU SCOUT-O3 project and U.K. NERC UTLS OZONE Programme. ECMWF analyses were provided via the British Atmospheric Data Centre (BADC). References Chipperfield, M.P. , JGR, 104, 1781-1805, 1999. Feng W, et al, GRL, doi:10.1029/2006GL029098,2007.