Download
1 / 1
20 likes | 297 Views
NMDESS: A Decision Support System for Nutrient Management E. O. Mutlu 1 , I. Chaubey 1 , M. Matlock 1 , R. Morgan 1 , B. Haggard 1 , D. E. Storm 2 Ecological Engineering Group 1 Biological & Agricultural Engineering Department - University of Arkansas, Fayetteville, AR

E N D
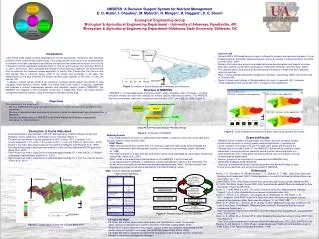
NMDESS: A Decision Support System for Nutrient Management E. O. Mutlu1, I. Chaubey1, M. Matlock1, R. Morgan1, B. Haggard1, D. E. Storm2 Ecological Engineering Group 1Biological & Agricultural Engineering Department - University of Arkansas, Fayetteville, AR 2Biosystem & AgriculturalEngineering Department-Oklahoma State University, Stillwater, OK Education NMDESS Analysis Deliberation Watershed Management Recommendation Introduction Lake Eucha water quality is being degraded from excess algal growth, resulting in odor and taste problems in this critical drinking water supply. This excess growth is the result of an overabundance of nutrients in the lake, assumed to be primarily phosphorus from either point sources, such as City of Decatur municipal wastewater treatment plant, or from non point sources from pastures (Storm et al., 2001). Storm et al. (2001) attributed the majority of the phosphorus loading to non point sources such as pastures that received surface application of poultry litter. Phosphorus from the soil and land applied litter is transport during runoff to the stream and eventually to the lake. The eutrophication of the lake threatens the primary drinking water supplies of the cities of Tulsa, OK and Jay, OK. A decision support system (DSS) is an interactive computer based system that intends to help managers make decisions (Power, 1998). The overall goal of this study is to develop, implement and evaluate a nutrient management decision and education support system (NMDESS). The NMDESS will integrate a GIS ecosystem model with a stakeholder driven risk based nutrient management decision process, using bio-indicators and water quality data. • Scenario 360 • Scenario 360 is GIS based decision support software for planners and resource managers. It is an • ArcMap extension that adds interactive analysis tools and a decision-making framework to ArcGIS • (Communityviz, 2004), • Scenario 360 helps view, analyze and understand potential alternatives and impacts via visual • exploration and the construction and analysis of alternative scenarios (Communityviz, 2004), • This software allows illustrating and discussing future scenarios in watershed and visualizing • results in real time, • Table 1 shows example watershed management scenarios, analyzed by SWAT, that will be used • in Scenario 360, • Figure 5 shows output display of litter application for current, scenario#1 (25 % increase • in litter application) and scenario#2 (50 % increase in litter application). Oklahoma Arkansas Kilometer 30 60 50 0 10 20 40 Figure 1: Location of Eucha Watershed in Arkansas and Oklahoma Structure of NMDESS NMDESS is a knowledge-based computer system which integrates data, information, physical simulation models and economic analysis for solving specific watershed problems. The NMDESS has three components: data entry, a graphical user interface (GUI), and a GIS (Arc-IMS) (Figure 3). SW1 (Current in litter application) SW1 (25 % increase in litter application) • Objectives • The objectives of this study are to: • Develop NMDESS to provide risk based information on nutrient sources and fate within Eucha watershed, • Develop a stakeholder input and advisory structure to guide the development and implementation of NMDESS, • Evaluate the effectiveness of NMDESS in the Eucha Watershed to develop management alternatives for implementation. Graphical User Interface (GUI) Data Entry Models SW1 (50 % increase in litter application) Spatial Database Arc-IMS 0 10 20 40 Kilometers Selection Part Very High Low Medium Very Low High Decision Design Output Results Scenario Analysis • Description of Eucha Watershed • Eucha watershed is approximately 1079 km2 drainage basin, located in Mayes County and • Delaware County, Oklahoma, and Benton County, Arkansas (Figure 1), • The land use distribution in Eucha watershed is 50.9 % forest, 42.7 % pasture, 0.3 % • brushy rangeland, 1.5 % urban, 1.9 % water, and 2.7 % row crop (Figure 2) (Storm et al., 2002), • Poultry is the major agricultural product in the watershed (Wagner and Woodruff et al., 1997), • The observed average total phosphorus loading to Lake Eucha is estimated 47600 kg per year • (Storm et al., 2001), • Total Phosphorus load to Lake Eucha is estimated approximately 27 % from the City of Decatur • wastewater treatment plant (Storm et al., 2001), • Total Phosphorus load to Lake Eucha is estimated approximately 73 % from the nonpoint sources • (Storm et al., 2001). Figure 5 : Land management scenarios analysis result using scenario 360 model Figure 3 : Schematic of NMDESS • Modeling System • The modeling system consists of a watershed model (SWAT), a reservoir model (CE-QUAL-W2)and a decision support model (Scenario 360). • SWAT Model • SWAT (Soil and Water Assessment Tool) is a continuous daily time-step model which simulates the • impacts of alternative land management practices on surface and ground water quality (Arnold et • al., 1998), • The model operates on a daily time step and allows a basin to be subdivided into grid cells or natural sub- • watersheds (Santhi et al., 2001), • SWAT model is the watershed model backbone for the NMDESS. It will be linked with • a risk based scenario generator to predict flow, nutrient and sediment load from the watershed. The • model will be calibrated and validated with available measured data. Table 1 lists the example land • management scenarios that will be analyzed by the linked modeling system. • Expected Results • NMDESS will be created to integrate data, information, physical simulation models • and economic analysis for solving specific watershed problems, to evaluate the • source, transport, and impact of N and P on lake water quality and to protect the • intended uses of the lake (Figure 4). The NMDESS interface will be created to assist • stakeholder in analyzing various scenarios and drop down menus and buttons to • select watershed, farm or field within the watershed and input any scenario from the • list developed by stakeholders. • Advisory groups will be organized in the watershed and NMDESS using • stakeholder feedback will be developed. • Hydrologic and watershed factors regulating nutrient retention and loading to Lake • Eucha will be identified, and will be incorporated in NMDESS. References Arnold, J. G., Srinivasan, R., Ramanarayanan, T. S., Bednarz, S. T. 1998. Large Area Hydrologic Modeling and Assessment Part II : Model Application. Journal of the American Water Resources Association. 34. 1. 91 Communityviz. 2004. (http://www.communityviz.com/index.asp?circuit=2&fuse=detail&cid=395) CE-QUAL-W2 Water Quality Model. 2002. (http://www.cee.pdx.edu/w2/,Web site designed by Kyle Muramatsu | Summer ASE 2002) Power, D. J.1998. What is a DSS. The online Executive Journal for Data-Intensive Decision Support.1. No 3. (http://dssresources.com/papers/whatisadss/index.html) Santhi, C., Arnold. J. G., Williams. J. G., Dugas. W. A., Srinivasan. R., and Hauck. L. M. 2001. Validation of the SWAT model on a large river basin with point and nonpoint sources. Journal of the American Water Resources Association. 37. (5): 1169-1188 Storm, D. E., White, M. J., Smolen, M. D., Zhang, H. 2001. Modeling Phosphorus Loading for the Lake Eucha Basin. Final Report. Oklahoma State University. Biosystems and Agricultural Engineering Department. 1. (http://biosystems.okstate.edu/home/dstorm/eucha/modeling/OSU_EuchaReport__ExecutiveSummary_110101.pdf) Storm, D. E., White, M. J., Smolen, M. D. 2002. Modeling the Lake Eucha Basin Using SWAT 2000. Final Report. 4 (http://biosystems.okstate.edu/home/dstorm/eucha/modeling/Eucha_OSU_2002_SWAT2000.pdf) Wagner, K. and Woodruf, S. 1997. Phase 1 clean lakes project diagnostic and feasibility study of Lake Eucha. Final Report. Executive Summary. 1-148 Table 1: List of scenarios and SWAT modeloutputs requested Analysis Scientists, engineers and policy makers collect, analyze data, present to stakeholders Management Practice Scenarios Oklahoma Objective 1: Develop DSS Arkansas Deliberation Stakeholders review and interpret data, inform scientists and policymakers Objective 2: Develop Stakeholder Structure Objective 3: Develop Lake Nutrient Load Endpoints Nutrient Management Strategy for Lake Eucha Evaluation Performed by stakeholders, policy makers, Coop Extension Objective 4: Evaluate DSS Figure 4 : Process diagram of project activities Kilometers 0 10 20 40 • CE-QUAL-W2 Model • CE-QUAL-W2 is a two dimensionalwater quality and hydrodynamic model for estuaries, • lakes, reservoirs and river basin systems (CE-QUAL-W2 Water Quality Model, 2002), • Temperature-nutrient-algae-dissolved oxygen- organic matter and sediment relationships are W2 • models basic eutrophication processes (CE-QUAL-W2 Water Quality Model, 2002), • CE-QUAL-W2 will be calibrated for Lake Eucha and will be used to analyze reservoir response to • changes in watershed management strategies. Figure 2 : Classification ofland use in Eucha Watershed