Download
1 / 69
690 likes | 925 Views
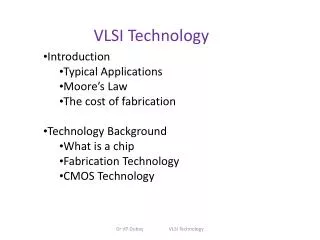
Strategic Technology Management Support: Models Technology Product and Process Life-Cycles Sequential and Simultaneous Innovation Models 3. Technology S-curve 4. Technology and Market Matrices 5. Expert System Decision Support: NEWTECH. 1. Technology Life Cycle Models. Technology Product LC

E N D
Strategic Technology Management Support: Models • Technology Product and Process Life-Cycles • Sequential and Simultaneous Innovation Models • 3. Technology S-curve • 4. Technology and Market Matrices • 5. Expert System Decision Support: NEWTECH
1. Technology Life Cycle Models • Technology Product LC • Technology Product & Process LC
Technology Product LC The change of sales/revenue/profits of a company/industry/sector in a longer time perspective Main phases: * Introduction; * Growth; * Maturity, and* Decline.
Technology Product Curve Maturity Sales/ Revenue/ Profit Decline Growth Introduction Time
Corporate/Business/Technology Strategy and Product LC models Sales/ Revenue/ Profit Product D Product A Product B Product C 1 4 Product E 5 3 2 Time
R&D, Marketing Strategy Options – investment into R&D projects • 1 - Short term development of existing product • 2 - Effort to prolong product life • 3 – Early introduction of the new product • 4 – Late introduction of new product • 5 - Long term development of new product generation
Sequential innovation model New product concept Functional specification Process specification Product specification Marketing and/or R&D New product general specific. NPD project Process design Production Discontinuity of Sequences/phases
Simultaneous innovation model (concurrent engineering model) NPD phases New product concept Functional specification Product specification Process specification Production Time
Sequential and SimultaneousInnovation Models NPD phases Simujltaneous devleopment Sequential development Time
Simultaneous model: Cross-functional interdisciplinary teams • NPD realized throughout with representatives of all the functions and organization areas in the earliest phases: • 1. Marketing (customer needs, competitors, special needs and demands); • 2. R&D (activities from idea generation to commercialization, patent protection and EoL considerations); • 3. Finance( investment funds management, financial feasibility studies, costs forecasting and planning); • 4. Legal aspects (external legal conditions, legal protection of intellectual property);
Simultaneous model: Cross-functional interdisciplinary teams • 5. Purchasing & Sales(relations with suppliers, customers, costs of material and components); • 6. Engineering and Production ( new engineering design, product safety, prototype building, manufacturing/process feasibility studies, resourse flexibility, product service potentials).
New products as projects • The conditions for innovation to occur are necessary but insufficient • The process is managed and operated by people • NPD is not the preserve of one department • It involves a variety of people across the organisation • Teams of people and project teams is at the heart of NPD
The NPD process as a series of linked activities Strategic planning Scientific and technological developments Assembling knowledge Market research Society and market developments leading to needs R&D Generating business opportunities Product concept generation Screening and evaluation is not a one-off activity – it is a continual process and takes place at every stage. Development of product prototypes Market and technical testing Market introduction
Matrix organisation structure Full time Part-time Senior management Sales Production Finance Marketing Research andtechnology Business Team 1 Business Team 2 Business Team 3
Assembling knowledge Networking by organisations’ employees (gatekeepers) Recruitment of good people Technology monitoring by R&D department Licensing, contract research, patents Knowledge base of the organisation Conferences, etc. Company’s own market research Other companies including customers, suppliers, competitors, etc. Internal R&D Publications, databases
Generating new business opportunities Competitors’ productsand reverse engineering Existing products Technology Individuals Unexploited patents Generation of business opportunities Brainstorming and synetics customers and vendors senior and top management
60 ideas are evaluated for: Number • Technical feasibility of research • Financial feasibility ideas • Suitability 12 ideas worthy of evaluation through: Technical evaluation & market research analysis 6 potential products worthy of further development & analysis 3 prototypes for technical & market testing 2 products launched 1 successful product Evaluation of research project ideas Evaluating research projects
Screening • It is not a single, one-off activity; • It occurs at every stage of the new product development process; • Do we have the necessary commercial knowledge and experience? • Do we have the technical know-how to develop the idea further? • Would such a product be suitable for our business? • Are we sure there will be sufficient demand? • The main purpose of screening ideas is to select those that will be successful and drop those that will not – herein lies the difficulty e.g. • RCA identified TV but not VCR. • Kodak and IBM failed to see the potential in photocopying butXerox did
The R&D/marketing interface • Scientists and engineers are often heard berating their commercial colleagues for failing to comprehend the technical aspects of the project; • The main barriers to effective R&D/marketing interface have been found to be related to perceptual, cultural, organisational and language factors (Wang, 1997).
The R&D/marketing interface (Continued) • Cultural difference results from the different training and backgrounds; Marketing managers tend to focus on shorter time spans than R&D managers who adopt much longer time frames for projects; • Language barrier; • The extent of the integration required between marketing and R&D varies between industries.
Technology Substitution Strategic Analysis • 1)External technology analysis- review of new technology that could substitute existing products based on technology competitor technology analysis, new technology development and technological forecasting; • 2) Timing aspects based on time analysis – the projected moment when new products are expected to be introduced on the market; • 3) Assessment of the rate/pace at which new products will penetrate the market; • 4) Assessment of the timing/moment when new product is to be launched on the market;
Technology Product & Process LC - TLC • Technology Life cycle is represented by technology product and process innovation dynamics; • The model is based on overall technology life cycle analysis based on detailed view of the product and process innovation potentials within the life cycle.
TLC curve – industry/firm analysis Innovation Rate Product Process Time/Innovation Focused Transition Fluid
TLC – phases based on process & product innovation dynamics • 1. Fluid • 2. Transition (Transmission) • 3. Focused (Specific, Maturity)
Innovation Rate I Fluid Intensive product change in the early phases of product introduction; in search of the product that best satisfies customer needs. II Transition Dominant product characteristics achieved; product innovation projects decline, process innovation projects rise towards standard process development for mass production. Time III Focused Evolutive/incremental process innovation, process & product innovation projects decline, high specialization, cost reduction, quality enhancement, efforts to prolong the TLC while still generating revenue.
Corporate/Business/Functional Strategy and TLC – Fluid phase Strong external orientation, intensive relations with firm environment; high product flexibility with intensive R&D projects coupled with market research (needs, competitors, institutes, laboratories, etc); organizational design oriented at high flexibility – matrix, project structures dominant;
Corporate/Business/Functional Strategy and TLC – Fluid phase • Dominant market orientation, intensive research of customer needs, competitor actions, demand projections and analysis, new market perspectives, global market penetration • High integrativeness of all functions, parts and domains of organization – marketing, R&D, technology, production, HR; • Multifunctional teams, Matrix/project organizational design
Corporate/Business/Functional Strategy and TLC – Transition phase Process innovation becomes dominant oriented at R&D projects leading to cutting costs, enhancing process characteristics and quality. In traditional manufacturing universal equipment is changed and special equipment installed for mass manufacturing and achieving economies of scale. Developing relations in the supply-chain.
3. Corporate/Business/Functional Strategy and TLC: Focused phase • Developing more rigid organizational structure (hierarchical levels defined, functional, departmental) • More centralised org. design and decision making • Clear definition of tasks and responsibilities in relation to corporate/business/functional goals
Organization and Mangament Developing teams, project structure Informal, entrepreneurial, decentralized Rigid structure, centralization
Flexible Technology Model Innovation Rate Process Innovation Product Innovation Time
Utterback – 4 phases in TLC • Fluid phase: • high level of technology & market uncertainty – pioneering products enter the market – need to promote technology – alliances, licensing & acquisition of start-ups • Transitional phase: • emergence of dominant design – improvement of technology – growth strategy & increase in production capacity – licensing when have dominant design or acquisition of those who have it… • Mature phase: • emphasis on process innovation – R&D alliances to share costs & risks – acquisitions, alliances with suppliers & divestures • Discontinuities phase: • New technologies emerging – existing technology can become obsolete – volatile market – new entrants
Alliances & Technology life cycle Source: MIT Sloan Mgt review, 2001
Alliances in Fluid phase • To promote technology as the industry standard: • Microsoft MSDOS with IBM PC • Adoption of licensing strategies: • SUN: SPARC & JAVA • Marketing alliances with key players in the supply chain or with one of the industry leader: • Ariba B2B solutions to find channels • Technology alliances with established companies: equity investments, JV’s: • Trusted Computing Platforms Alliance – In 1999, Compaq, HP, Intel, Microsoft & IBM joined forces to propose better security solutions on PC platforms • Acquisition of start-ups to get access to key technologies: Cisco, Microsoft acquired 15 companies & made 26 minority investments in Internet related technologies & application software. Source: MIT Sloan Mgt review, 2001
Alliances in Transitional phase • Licensing by dominant design firm: • Texas Instruments, Philips, Microsoft • Joint R&D ventures to improve dominant design & develop extensions: • VHS from JVC with Matsushita & RCA • Marketing alliances & supply agreements to guarantee consistent quality, price & availability: • VHS from JVC with Matsushita Source: MIT Sloan Mgt review, 2001
Alliances in Mature phase • Joint R&D ventures to share risks & costs of technology development: • Fujitsu Toshiba alliance in 1Gb DRAM (2000) • Microsoft 36 JV’s between 1988 & 1994 • Marketing alliances to attack latent markets or lure customers away from competitors: • Microsoft • Manufacturing alliances to ensure availability of essential products • Open alliances with suppliers & customers Source: MIT Sloan Mgt review, 2001
Alliances in Discontinuities phase • Marketing alliances to gain market recognition • Licensing by attacker to supply technology: • Microsoft licensing of Windows CE for AT&T set-top boxes - 1999 • Incumbent’s acquisition of the disruptive technology: • Intel: acquisition of 15 companies in networking & communications - 1999/2000 Source: MIT Sloan Mgt review, 2001
Region 1980–84 1985–89 Total Europe 17. 7 20. 1 19. 2 Europe – USA 22. 1 22. 5 22. 4 Europe\Japan 6. 5 5. 7 6. 0 USA 22. 9 25. 3 24. 4 USA – Japan 17. 6 11. 7 13. 9 Japan 4. 2 6. 2 5. 4 Triad – LDC 2. 2 2. 4 2. 3 Triad – MDC 1. 3 1. 5 1. 7 Other countries 5. 5 4. 4 4. 9 Total100. 0% 100. 0% 100. 0% Number alliance 1560. 0 2632. 0 4192. 0 Total 37. 2% 62. 8% 100.0%
Cooperation with clients Cooperation with competitors Cooperation with Ministries/agencies
ADVANTAGES DRAWBACKS 1. Technological Access to latest innovation of partner (info, design specific., R&D results, software)Sharing of R&D costs; Sharing competence, strengthening powers, synergy; Concentrated potentials for R&D; Critical mass for innovation (financial, creative, material) extended Leakage of strategic info Potential info abuse by partner Threat of third party gaining strategic info
ADVANATAGES DRAWBACKS 2. Marketing and sales Access to new markets Using partner reputation Sharing costs of promotion Using partner’s existing distribution network, post-sales services, maintainance and servicing Negotiating prices and avoiding price wars Using well known brand names Giving the partner access to own market Constraints on scale and market penetration rate Pressures on own distribution network to answer to the extended needs of the partner Loss of control over own trade mark, brand name Constraints to promotion strategies
ADVANTAGES DRAWBACKS 3. Manufacturing Infoon new products and processes Access to partner’s resources Cheaper components and parts Access to product assembly lines Advantages of augmented purchasing potential Greater potentials in licencing production Royalties from licencing Dependence on partner in supply Constraints in supplier choice and introducing new suppliers Quality problems
ADVANTAGES DRAWBACKS 4. Finances Opportunities in revenue distribution Attractive financial sources for joint venture New opportunities for improving cash flows Decreased dependency on exchange rate changes Certain loss in financial freedom of choice Limited investments 5. Managerial Using individual and joint experience Exchange of labour Joint efforts in training and development programmess for employees and management Presence in geographical regions where delegating own people would be too costly Serious problems in managing joint-venture Distinctive need for special mechanisms of coordination Constraints in the sphere of own programme development schemes