Evaluation of Body Composition
290 likes | 523 Views
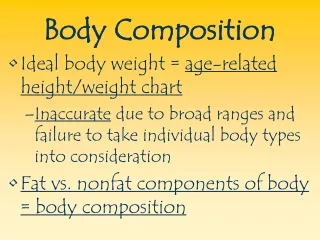
Height ? Weight Tables. Developed in 1940's by INSURANCE companies.Based solely on mortality statistics.Fatter people = increased risk of deathDo not take into account body composition!!!. Body Mass Index. BMI = Weight (kg) / Height (m) 2DesirableMen: 21.9 ? 22.4Women: 21.3 ? 22.1Over weigh

Evaluation of Body Composition
E N D
Presentation Transcript
1. Evaluation of Body Composition Chapter 14
2. Height � Weight Tables Developed in 1940�s by INSURANCE companies.
Based solely on mortality statistics.
Fatter people = increased risk of death
Do not take into account body composition!!!
3. Body Mass Index BMI = Weight (kg) / Height (m) 2
Desirable
Men: 21.9 � 22.4
Women: 21.3 � 22.1
Over weight: 25 - 30
Obese: >30
4. Body Mass Index BMI�s above 27 associated with ? incidence of hypertension, diabetes, & CHD.
Still used frequently by doctors and researchers.
Does not take body composition into account either!
5. Height: 5�10� = 1.77 m
Weight: 221 lbs = 100.45 kg
BMI = 32.09
THIS GUY IS OBESE !!!! Body Mass Index
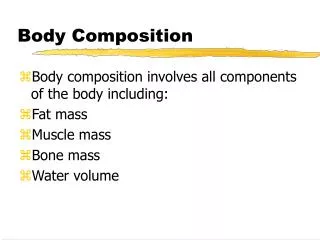
6. Structural Components Human body made up of:
Water
Protein (muscle)
Fat
Bone
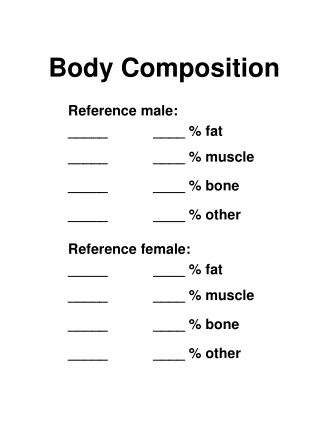
7. Reference Man / Woman Developed by Albert Behnke, MD
A theoretical model based on an �average� person.
Divides body into:
Lean Body Mass
Protein and Bone
Fat
Essential
Non-essential or storage
8. Reference Man
9. Reference Woman
10. Essential fat Fat stored in:
Bone marrow, heart, liver, lungs, spleen, kidneys, intestines, muscles, and CNS.
REQUIRED for NORMAL physiological function.
Women carry additional �gender specific� essential fat in mammary glands and in pelvic region, surrounding reproductive organs. (EF 3X�s greater in females)
11. Non-Essential / Storage Fat Fat accumulated in adipose tissue
Serves as nutritional reserve
Two compartments
Visceral
Subcutaneous
12. Lean Body Mass LBM = Body mass � storage fat
Includes essential fat / Fat free mass does not include EF
Male : 3% of LBM is essential fat = lower limit of leanness for normal function.
Female : 12-14% of LBM is essential fat = lower limit of leanness for normal female function.
13. Too Thin? Men: Less than 4% BF
Reduced exercise tolerance (especially LSD)
Increased dissipation of heat, Less work during weight bearing exercise
Women : Less than 17% BF
Oligomenorrhea � irregular menstruation
Amenorrhea � Cessation of menstrual cycle
Bone mineral loss
Decreased risk of cancer ? *
14. Assessing Body Composition Direct
Messy / Requires dissection & chemical analysis
Hard to recruit subjects
Indirect
Estimating body composition
Hydrostatic weighing
Skinfold measurements
Girth measurements
15. Hydrostatic Weighing Based on Archimedes principle
An object submerged in water has a counter force acting upward on it equal to the amount of water it displaces (buoyancy).
Able to determine VOLUME
17. Hydrostatic Weighing By determining weight lost under water, we can compute volume.
IE : 50 kg person weighs 2.5 kg under water
47.5 kg water displaced (density of 1 kg/L) = 47.5 liters of water displaced
We know mass and volume; we can calculate density!
Density = mass / volume
Density = 50 kg / 47.5 L = 1.0526
18. Hydrostatic Weighing We know that fat and lean body tissue have relatively stable densities
Fat = 0.9 g/cc
Fat Free Tissue = 1.1 g/cc
We can then calculate percent BF
% BF = (495 / Body Density) � 450
+/- 2.5% error
BF% = (495 / 1.0526) � 450 = 20.26%
19. Hydrostatic Weighing Draw Backs
Constant used for density of fat and LBM
Racial differences
Young vs. old
Active people � LBM = denser
Facilities
Requires exhaling ALL lung volume under water and estimation / measurement of RV
20. Skinfold Measurements Based on the rational that subcutaneous fat represents a certain % of total body fat.
Skinfold thickness (3 � 7 sites) measured using specialized calipers that exert exactly 10 g/mm2 pressure.
Sum of thickness readings can be placed into formulas to estimate BF %
+/- 3.7% error!
21. Skinfold Measurements Drawbacks
Not extremely accurate
Large inter-tester error rate
Variations in subjects (SC fat distribution)
Positives
Inexpensive equipment
More accurate than other alternatives
Easy test to perform
22. Girth Measurements Circumferences taken at different sights and a prediction equation is used to estimate body fat %.
Book claims 4% error, depends on individual tested !
Waist to Hip ratio appears to be useful !
Drawbacks
Does not take into account composition of girth (IE muscular individuals often over est.)
Relatively large error
23. Bioelectric Impedance Increasingly popular technique that does not work!!!
Measures body�s resistance to electricity
Muscle less resistant (H2O and electrolytes)
Fat is an insulator
Estimates composition / density based on impedance of electrical current.
24. Bioelectric Impedance Drawbacks
Hydration levels change and greatly effect outcomes (less water = higher BF)
Exercise
Fluid intake
Female menstrual cycle
Skin temperature
Warm skin conducts electricity better (? BF)
25. Non Invasive Scanning Techniques CT Scan
Cross sectional radiographic images of various parts of the body.
Most often used to determine changes in subcutaneous fat in a limb. (research)
MRI (magnetic resonance imaging)
Electromagnetic radiation in strong magnetic field excites H+ ions in water and lipid molecules. Gives off measurable signal � image.
Provides cross sectional images. Used most in research.
26. Non Invasive Scanning Techniques DEXA scan (dual-energy X-ray absorptiometry)
Measures absorption of two different x-rays as they pass through body.
Able to scan entire body in about 12 minutes.
Able to quantify bone mineral content, fat free body mass, and total fat mass.
Dual-photon Absorptiometry
27. Desirable Body Fat % Most Americans are still overweight!!!
CDC Statistics: 1990�s
27% of women & and 24% of men are �significantly overweight�
Unchanged from 1960�s
Increased awareness of the health implications of being �over fat� is necessary.
Linked to CHD, hypertension, cancer, diabetes, and stroke!
28. Desirable Body Fat % Men: <15% (18% for older men)
Women: 12 - 25% (12 � 30% for older women)
Body fat tends to increase as we age
Less activity / same caloric intake
Decreased metabolism
Decrease in metabolically active muscle tissue
Aging process (Hormonal changes, etc)
29. Calculations Calculating LBM (FFBM) & FM
100 kg (220 lb. Male w/ BF = 18%)
Fat Mass = Body Mass X Percent Fat
FM = 100 kg X .18
FM = 18 kg (39.6 lbs.)
FFBM = Body mass � Fat Mass
FFBM = 100 kg � 18 kg
FFBM = 82 kg (180.4 lbs.)
30. Calculations Calculating desired body mass
Body MassDesired = LBM / (1.0 � BF%Desired)
Desirable Fat Loss
Fat loss = Body MassPresent - Body MassDesired
Remember: Often times LBM increases with exercise�.Resulting in need to recalculate Body MassDesired or �Target Weight�