Download

1 / 9
90 likes | 395 Views
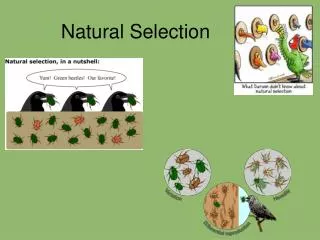
I’m a Survivor! by Peppered Moth. Marina Korolis Kerrie Lynch Heather Miles Tiffany Russow Kristen Thomas Jennifer Tulley. The Peppered Moths. Science Learning Goals. In this lesson, the students will: Observe changes in population dynamics

E N D
I’m a Survivor!by Peppered Moth Marina Korolis Kerrie Lynch Heather Miles Tiffany Russow Kristen Thomas Jennifer Tulley
Science Learning Goals In this lesson, the students will: • Observe changes in population dynamics • Use a computer to run a simulation of natural selection within a colony of peppered moths • Identify the variables that cause changes in the ratios of light to dark moths • Evaluate the impact humans have on the evolution of an indigenous species
Math Learning Goals In this lesson, the students will: • Draw scatter plots to represent the relationship between two variables • Familiarize themselves with statistical functions, namely linear regression and correlation coefficients
Lesson Activities Day 1 • Introduction to and exploration of Fathom and Netlogo Day 2 • In groups of four, students will run the peppered moths simulation (2 students from biology class and 2 students from statistics class) • Students from biology share the evolutionary aspects of the simulation with their group members while the math students share how to analyze the data
Technological Value • Students can quickly and efficiently collect data using Netlogo • Fathom helps students to visualize statistical plots • Students have access to quick analysis
Diversity • This simulation involves open-ended exploration which challenges students of varying abilities. • Exploring human impact on different parts of the world.
Here is a graph representing the relationship between light colored moths and pollution Correlation coefficient = -0.866675 Equation: M=-2.26P + 276
This is a graph of dark colored moths and pollution Correlation coefficient: 0.885871 Equation: D = 2.39P - 37