Download
1 / 1
20 likes | 141 Views
LG 8. LG 2. 0. AA-CTAG4. 8. Na12_G12. 0. AA-CATG4. Mar34. F1. 39. AA-CATG8. 48. AA-CTAG2. GD33. 50. AA-CTAM5. LG 4. LG 1. 66. AA-CTAM6. 20. AC-CACG13. LG 6. LG 7. 24. AA-CATM5. 0. AC-CTAM6. 27. AC-CAAM4. 0. AC-CTAM5. 2. AC-CTAM10. 0. AC-CTAM11. 0.

E N D
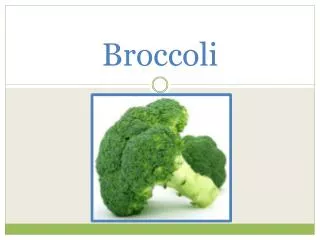
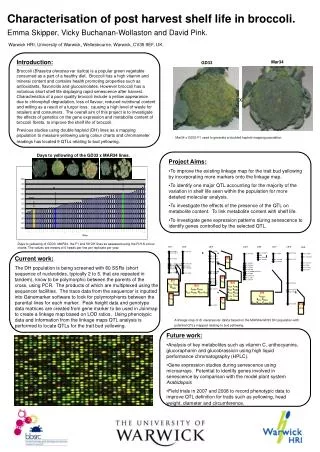
LG 8 LG 2 0 AA-CTAG4 8 Na12_G12 0 AA-CATG4 Mar34 F1 39 AA-CATG8 48 AA-CTAG2 GD33 50 AA-CTAM5 LG 4 LG 1 66 AA-CTAM6 20 AC-CACG13 LG6 LG 7 24 AA-CATM5 0 AC-CTAM6 27 AC-CAAM4 0 AC-CTAM5 2 AC-CTAM10 0 AC-CTAM11 0 Ol12_G04 8 AC-CTAM1 3 MB4 36 Na12_H09 BY4 aCC4 5 AC-CATG5 12 AC-CATG6 8 AC-CAGG2 8 AC-CACM6 12 AC-CACM9 17 Ol10_D08 AC-CACM7 10 BY1 HCC4, aCHR3 HCHR3 22 AC-CTCM3 AC-CACM8 BY3 LCHR3, bCHR3 HCC3, CCHR3, HCC4, aCC4, 23 AC-CAGM2 AC-CTCM6 25 AC-CATG2 27 AC-CACM2 35 AC-CAGG4 36 AC-CAGM4 35 AA-CATM6 BY5 aCC3 46 BN83B1 51 AA-CTAM7 BY6 LCC3, LCHR3 bCC3, bCHR3 HCC3, HCC4, CCC3, CCHR3 aCC4, 52 AC-CTAG7 54 AC-CTAG3 LG 5 63 AC-CACG7 0 AC-CATM3 BY9 LCHR4 BY2 aCC4 14 AC-CAGG3 BY7 CCC4 18 AC-CAAG3 21 AC-CAAG4 22 AC-CATM5 AC-CTAM12 AA-CATG12 23 AA-CTAM2 90 AA-CTAM8 24 AA-CATG18 29 Na12_C08 32 AC-CATG4 LG 9 BY8 LCHR3, bCC3, bCHR3 HCC3, HCC4, CCHR3, aCC4 0 AA-CATM7 4 AC-CTAG10 12 AC-CTCG2 15 AA-CTAG5 18 AC-CTCG1 21 AC-CTCM1 Characterisation of post harvest shelf life in broccoli. Emma Skipper, Vicky Buchanan-Wollaston and David Pink. Warwick HRI, University of Warwick, Wellesbourne, Warwick, CV35 9EF, UK. Introduction: Broccoli (Brassica oleracea var italica) is a popular green vegetable consumed as a part of a healthy diet. Broccoli has a high vitamin and mineral content and contains health promoting properties such as antioxidants, flavonoids and glucosinolates. However broccoli has a notorious short shelf life displaying rapid senescence after harvest. Characteristics of a poor quality broccoli include a yellow appearance due to chlorophyll degradation, loss of flavour, reduced nutritional content and wilting as a result of a turgor loss, causing a high level of waste for retailers and consumers. The overall aim of this project is to investigate the effects of genetics on the gene expression and metabolite content of broccoli florets, to improve the shelf life of broccoli. Previous studies using double haploid (DH) lines as a mapping population to measure yellowing using colour charts and chromameter readings has located 9 QTLs relating to bud yellowing. Mar34 GD33 X Mar34 x GD33 F1 used to generate a doubled haploid mapping population Days to yellowing of the GD33 x MAR34 lines. • Project Aims: • To improve the existing linkage map for the trait bud yellowing by incorporating more markers onto the linkage map. • To identify one major QTL accounting for the majority of the variation in shelf life seen within the population for more detailed molecular analysis. • To investigate the effects of the presence of the QTL on metabolite content. To link metabolite content with shelf life. • To investigate gene expression patterns during senescence to identify genes controlled by the selected QTL. Days to yellowing of GD33, MAR34, the F1 and 59 DH lines as assessed using the R.H.S colour charts. The values are means of 6 heads per line per replicate per year. Current work: The DH population is being screened with 60 SSRs (short sequence of nucleotides, typically 2 to 5, that are repeated in tandem), know to be polymorphic between the parents of the cross, using PCR. The products of which are multiplexed using the sequencer facilities. The trace data from the sequencer is inputted into Genemarker software to look for polymorphisms between the parental lines for each marker. Peak height data and genotype data matrices are created from gene marker to be used in Joinmap to create a linkage map based on LOD ratios. Using phenotypic data and information from the linkage maps QTL analysis is performed to locate QTLs for the trait bud yellowing. A linkage map of B. oleracea var italica based on the MAR34xGD33 DH population with potential QTLs mapped relating to bud yellowing. • Future work: • Analysis of key metabolites such as vitamin C, anthocyanins, glucoraphanin and glucobrassicin using high liquid performance chromatography (HPLC). • Gene expression studies during senescence using microarrays. Potential to identify genes involved in senescence by comparison with the model plant system Arabidopsis • Field trials in 2007 and 2008 to record phenotypic data to improve QTL definition for traits such as yellowing, head weight, diameter and circumference.