Understanding Data Collection and Graphing Techniques for Quantitative and Qualitative Information
This guide explores the essential concepts of data collection, focusing on both quantitative and qualitative information. Learn the importance of organizing data in tables, what makes a good data table, and the various types of graphs including bar graphs, histograms, pie charts, and line graphs. Discover the differences between bar graphs and histograms, and follow clear steps to create effective graphs, including labeling axes, choosing scales, and plotting data accurately. Enhance your data visualization skills for better understanding.

Understanding Data Collection and Graphing Techniques for Quantitative and Qualitative Information
E N D
Presentation Transcript
Graphing Notes Quantitative Numbers Qualitative Descriptions
Graphing • What kind is easiest to graph? • Quantitative
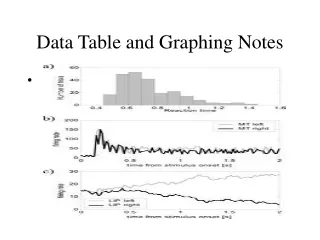
How do we collect data? • We collect data by • Observing quantitative & qualitative information. • We use data tables to collect the data. • What makes a good data table? • Title • Neat & Organized • Easy to read units • Easy to use • Anything else?
Types of graphs?? • There are many types of graphs. • Bar • Histograms
Bar graph vs. histogram • What is the difference between a bar graph and a histogram? • They look the same right? • There are 2 differences • Type of data • Way they are drawn • Bar Graph • Categorical data • Histogram • Continuous data
Types of Graphs • There are many types of graphs • Pie charts • Line Graphs
Making a Graph • Steps to making a graph • 1.) Figure out • What kind of graph you need. • 2.) Label • Come up with a title and label x & y axis. • 3.) Scale • Choose your scale-this is numerical…. 5’s, 10’s, decimals???? • 4.) Data • Plot your data on your graph! Easy!