Download

1 / 22
220 likes | 364 Views
Kalisha Holmes Exercise #1: Case Studies in Sensing and Data Collection. Real-Time Cities: an Introduction to Urban Cybernetics Harvard Design School: SCI 0646900 Spring 2014. Narrative Title.

E N D
Kalisha Holmes Exercise #1: Case Studies in Sensing and Data Collection Real-Time Cities: an Introduction to Urban Cybernetics Harvard Design School: SCI 0646900 Spring 2014
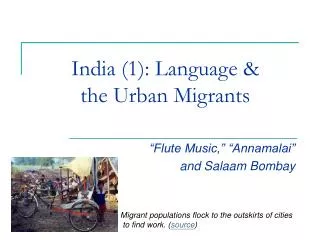
Narrative Title Every day we upload valuable information online simply by interacting with social media or even sending search queries to Google. This information can be extremely valuable to policymakers who want to map cities and accordingly more effectively and efficiently deliver services. Collecting and then organizing this data has become a gargantuan task, but the rewards can be equally satisfying to policymakers and users themselves. 1 | Lightbeam by Mozilla 2 | Ushahidi 3 | Waze 4 | Trendsmap 5 | Google Flu
1 | Lightbeam by Mozilla Lightbeam by the Mozilla corporation visualizes first and third-parties who are tracking online activity. As can be seen in the picture below, it shows the connections between yourself, any website you’ve visited, and third-party partners. The add-on then outputs a map showing the relationship visually. It also keeps track of all the users in aggregate to reveal trends in third-party monitoring Project Video: https://www.youtube.com/watch?v=PvqGy9wz_wA
1 | Lightbeam by Mozilla How was the data collected? The data is collected when users opt-in to the program. Why was the data collected? What is interesting about the data? The data is collected because although third-party tracking of online activity is common, there’s very few user interfaces to return that information about who is monitoring back to users. What stories about the urban dynamics can the collected data tell? This data can tell us a story of who is tracking our online activity and illuminate answers to why. What sort of questions about urban dynamics can be answered by looking at the data? Lightbeam is part of a larger mission to make our digital world more transparent and put our online experience back into our hands. This helps to better regulate our digital village. Moreover, in aggregate, this data can reveal interesting geographic trends in advertising How is the magnitude of the data is dealt with; limiting the collected data, limiting the dimensions in the data set, or abstracting the data? The magnitude of the data is all in the same format, so it is then categorized into various categories that make sense to then glean important details about online relationships between websites, users and third-parties. For example:
1 | Lightbeam by Mozilla How are particular patterns highlighted through techniques for tagging the data in order of their importance? It’s still unclear because the service is quite new. How does the original question to be addressed operate as the benchmark for eliminating unnecessary details in the data? The original question to be answered is actually very narrow, so it naturally eliminates unnecessary data. Is the data of a static or dynamic nature? If dynamic, what is the frequency of change and what happens when it starts to change? The data is dynamic and updates every time a new website is visited. Who is the target audience of the data presentation? The target audience of this data presentation are users themselves, so they can have greater control of their personal data online. What are their goals when approaching the data presentation? What do they stand to learn? The main goal of this project is to raise awareness about online privacy and who is collecting data on your online behavior and when. Ultimately, Mozilla wants to give users the tools to better control their personal data and provide more transparency in the process of data tracking online.
2 | Ushahidi Ushahidi offers free and open-source software that can be used for information collection, data visualization and interactive mapping. The platforms allow users to submit information that eventually aggregates to offer geospatial mapping of crisis situations. For example, after the 2010 earthquake in Haiti, Ushahidi software was used to allow Haitians to input their situations into a map. This was then used by several humanitarian organizations to coordinate emergency services in the areas of greatest need. Project Video: http://www.youtube.com/watch?v=EhT3co2qNAA
2 | Ushahidi How was the data collected? The data is user-generated. During a crisis, users will input data manually creating a large crowd-sourced database. Why was the data collected? What is interesting about the data? The data is collected for a variety of reasons, depending on the type of crisis. During humanitarian crises, the data is used to direct emergency services. During elections, it is used to more effectively monitor election processes. What stories about the urban dynamics can the collected data tell? The collected data helps policymakers in crisis situations direct limited resources with real-time information. This tells us where in urban areas, resources are needed the most. What sort of questions about urban dynamics can be answered by looking at the data? This data can answer all types of questions about human behavior and interaction with space in a disaster situation. How is the magnitude of the data is dealt with; limiting the collected data, limiting the dimensions in the data set, or abstracting the data? The data is organized into categories before users submit information. In this way, the dataset is already neatly organized into usable categories for policymakers and emergency personnel.
2 | Ushahidi How are particular patterns highlighted through techniques for tagging the data in order of their importance? The system allows for categorical classification of emergencies. This allows for hierarchical ranking if that is the need of the policymaker. How does the original question to be addressed operate as the benchmark for eliminating unnecessary details in the data? The original question to be addressed by this project, is where to direct limited emergency resources. Therefore, data can be tailored to be only as detailed as necessary by the designers of the project Is the data of a static or dynamic nature? If dynamic, what is the frequency of change and what happens when it starts to change? The data is dynamic and updates every time a user inputs new information. Who is the target audience of the data presentation? The target audience of this data presentation are policymakers and emergency personnel. What are their goals when approaching the data presentation? What do they stand to learn? The primary goal is to provide geo-spatial information on where resources need to be directed. The presentation of this data in a visual map provides accurate and real-time updated information that can save countless lives in crisis situations.
3 | Waze Waze is an interactive map that integrates directions and lots of other useful information for drivers to make the driving experience more interactive, social and ultimately to improve the quality of commuting. Waze provides a platform for users to upload all types of data into a single platform to empower drivers to make better decisions on which route to take, how to avoid receiving a traffic violation, etc. Project Video: http://www.youtube.com/watch?v=y_7yoEUrVhw
3 | Waze How was the data collected? Any user on the system is automatically inputted into the map, but users can also input more complex data. Why was the data collected? What is interesting about the data? The data is interesting because it reveals all types of constantly changing traffic trends. It is notoriously difficult to predict traffic, but the interactiveness of this app takes away some of that uncertainty and updates in real-time. What stories about the urban dynamics can the collected data tell? The data can show us how and where traffic congestion begins, and can direct city resources to more pressing traffic areas. What sort of questions about urban dynamics can be answered by looking at the data? Questions about where potholes, severe congestion and unfair traffic traps are can help to more accurately direct government resources to pressing problems. How is the magnitude of the data is dealt with; limiting the collected data, limiting the dimensions in the data set, or abstracting the data? This data is massive, but symbols help to organize data, and on the map interface, what is displayed to the user is limited unless specific actions are requested.
3 | Waze How are particular patterns highlighted through techniques for tagging the data in order of their importance? The most important tag in this data is simply geographic location and speed of travel. Everything else is of lower importance and can be displayed according to user preference. How does the original question to be addressed operate as the benchmark for eliminating unnecessary details in the data? The original question to be addressed leaves an expansive definition of what data to include, and this may be somewhat of a problem. Is the data of a static or dynamic nature? If dynamic, what is the frequency of change and what happens when it starts to change? The data is dynamic and updates every time a user uses the application. Who is the target audience of the data presentation? The target audience of this data presentation are drivers who can then use that information to make more informed transportation decisions. What are their goals when approaching the data presentation? What do they stand to learn? This type of data presentation can turn users into actuators of their environment. Armed with real-time information about potential impediments to smooth travel, they can then make better decisions which will then make our physical transportation infrastructure more efficient.
4 | Trendsmap Trendsmap maps Twitter trending topics by location. Clicking on a trend will show a live feed of the actual tweets being sent out on this topic. It allows for a level of detail about social trends not available within Twitter itself, and can help better understand urban trends as they relate to social topics. Project Video: http://vimeo.com/69526096
4 | Trendsmap How was the data collected? The data is a mashup of user-generated data and Google mapping services. All of the geotagging and content are by-products of users actually using online services. Why was the data collected? What is interesting about the data? The data is interesting because it brings completely new narratives about trends to visual light. What stories about the urban dynamics can the collected data tell? The data can tell all types of stories about real-time social trends. It also can help to map social networking activity geographically. What sort of questions about urban dynamics can be answered by looking at the data? By looking at this data, we can answer questions about what people care about, and how well connected people are geographically to the digital world. How is the magnitude of the data is dealt with; limiting the collected data, limiting the dimensions in the data set, or abstracting the data? The magnitude of this data is dealt with by abstracting the data. Twitter trends are notoriously hard to map in a coherent way, but this application allows the user to see macro-trends in abstraction with geography, and then to zoom into individual tweets about a trending topic if necessary on a micro-level.
4 | Trendsmap How are particular patterns highlighted through techniques for tagging the data in order of their importance? The application mainly shows super popular trends rather than less popular but also important trends in the populace. The emphasis is on magnitude. How does the original question to be addressed operate as the benchmark for eliminating unnecessary details in the data? The original question is simple and complex at the same time. It includes the entire universe of tweets, so no data needs to be eliminated, but organizing it necessarily includes ignoring non-”viral” trends on Twitter. Is the data of a static or dynamic nature? If dynamic, what is the frequency of change and what happens when it starts to change? The data is dynamic and updates every time a new tweet is sent. Who is the target audience of the data presentation? The target audience of this data presentation can be anybody with an interest including businesses, governments and users who are simply curious about spatial organization of social trends. What are their goals when approaching the data presentation? What do they stand to learn? From this project, we can learn important truths about social organization by place. We always try to guess how social trends are spreading by place and time, but this data presentation gives a coherent way to visualize a great amount of data in ways that were not possible before.
5 | Google Flu Google Flu Trends is an approximate measure of flu activity based on Google search frequency. Google estimates worldwide trends for the flu using frequency of search terms and geo-tagging. Google then aggregates that data over time, place and estimated severity. Project Video: http://www.youtube.com/watch?v=6111nS66Dpk
5 | Google Flu How was the data collected? The data is collected by aggregating Google search queries around the relevant words. Why was the data collected? What is interesting about the data? The data is collected regardless of it is organized by Google in order to improve its search functions. It’s interesting to see trends over time of flu infections. What stories about the urban dynamics can the collected data tell? The data can tell the story of where in urban areas there might be potential flu outbreaks. What sort of questions about urban dynamics can be answered by looking at the data? By looking at the data, we can see how a very contagious virus spreads over place and time, and can accordingly track how well interventions appear to be working to combat those outbreaks. How is the magnitude of the data is dealt with; limiting the collected data, limiting the dimensions in the data set, or abstracting the data? Answer… …
5 | Google Flu How are particular patterns highlighted through techniques for tagging the data in order of their importance? I’m not sure. How does the original question to be addressed operate as the benchmark for eliminating unnecessary details in the data? The original question allows all other irrelevant search terms to be eliminated from graphical displays. Is the data of a static or dynamic nature? If dynamic, what is the frequency of change and what happens when it starts to change? The data is dynamic and updates every time a user queries a new search. Who is the target audience of the data presentation? The target audience of this data presentation are policymakers and public health personnel primarily. What are their goals when approaching the data presentation? What do they stand to learn? The goal of this visualization of flu search queries is to work as a proxy for identifying worrying spikes in flu infections and direct public health resources accordingly. This is the most detailed information available to policymakers to understand the geospatial trends of flu infections worldwide.