Download
1 / 27
270 likes | 367 Views
Explore innovative interaction-detection methods to extract biological information, evaluate data quality, biases, and coverage, and construct protein-protein interaction networks for comprehensive insights.

E N D
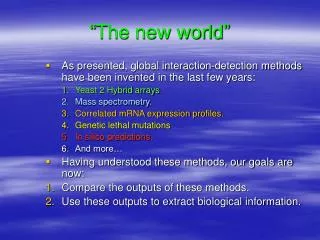
“The new world” • As presented, global interaction-detection methods have been invented in the last few years: • Yeast 2 Hybrid arrays. • Mass spectrometry. • Correlated mRNA expression profiles. • Genetic lethal mutations • In silico predictions. • And more… • Having understood these methods, our goals are now: • Compare the outputs of these methods. • Use these outputs to extract biological information.
Method evaluation • Vast amounts of interaction data has emerged: for each method a PPI database was created. • Our first goal is to compare these databases: • Accuracy • Biases • Overlaps • Complementarities • We’ll present this based on the following article: Comparative assessment of large-scale data sets of protein-protein interactions. von Mering C, Krause R, Snel B, Cornell M, Oliver SG, Fields S, Bork P.
Method evaluation • Comparing interaction data is difficult. • However, there is only difficult in bread. • To overcome these difficulties, a few decisions are made: A. The common unit of analysis for this study- binary interactions. B. We will focus on the Yeast proteome C. The reference sets- manually made catalogues of known protein complexes: • YPD • MIPS
Overlaps and complementarities • About 80,000 yeast PPI’s are currently available from all latest databases combined. • Surprisingly, only about 2,400 (~3%) are supported by more than one method. • Possible explanations: • The methods have not reached saturation. • Significant amount of false-positives. • Complementarities- strengths and weaknesses of each method. To illustrate this, look at the following graph…
Quality evaluation • Quality of the methods consists of: • Coverage • Accuracy • Comparing the data with a reference set allows evaluation of these methods.
Quality evaluation • An independent measure of quality : To what degree do the methods describe PPI’s between proteins within the same functional group. • This is well shown in the first graph:
Biases in interaction coverage • None of the methods covers more than 60% of the proteins in the yeast genome. • Are there common biases as to which proteins are covered? • Yes! There are areas in the databases where biases are found: • “Democracy”- Common, abundant proteins are “preferred”. • “Oligarchy”- Proteins from specific cellular locations are “preferred”. • “Monarchy”- Ancient, conserved proteins are “preferred” over proteins that emerged later in evolution.
Protein-protein interaction networks • Having evaluated our methods, our next goal is to use their outputs- PPI databases. • How can we organize this data in order to extract valuable information from it? • Networks ! • 2 general kinds of networks- • Simple PPI’s network. • Category-divided PPI’s network.
Protein-protein interactions networks • Why networks? • Simple networks visualize the amount and type of Interactions that occur for each protein. • Category-divided networks reveal a lot more- to what extent do proteins of different cell locations or different functions interact? • Characterizing proteins according to the proteins they interact with. Now that we’re convinced, we’ll consult A network of protein-protein interactions in yeast. Schwikowski B, Uetz P, Fields S.
Protein-protein interactions networks • 2,709 PPI’s were analyzed, consisting of 2,039 yeast proteins. • A surprising result was discovered:
Creating the network • Proteins have been assigned 42 cellular roles, for example-cell structure, mitosis, etc. • 1,485 have been categorized, 39% with more than one role. • “cluster”- any 3 or more proteins of the same function, separated by no more than 2 other proteins. • For example- 89% of chromatin proteins are within clusters.
cluster PPI network
Assessing the quality of the data • In order to assess the quality of the network, we use the following algorithm: • For each characterized protein, with at least one characterized partner: • A list of the functions of its neighbors is made. • If the function of the protein is among the 3 most common functions in the list, we say it is a correct classification.
Example of assessment true ! true or false? false ! true or false?
Results of assessment • 72% were marked correct. • On random links only 12% were marked correct- the network seems valid. • The 28% might be due to- • False-positives. • Incomplete annotations • Cross-talk • Unknown biological connections.
Crosstalk between and within functional groups • Relationships between functional groups might be biologically meaningful. • 65% of the interactions occur between proteins with a common function. • But, it is the minority which is interesting…
Crosstalk between functional groups ! ! ? # interactions within group # proteins in a group
Crosstalk between and within subcellular compartments • It is probable that proteins from the same cellular area interact (as with same function) • 78% of the PPI’s involving proteins with known localization, occur between proteins of the same cellular compartment. • Interaction between groups of different areas are meaningful here as well:
Prediction of function • Of the 2,039 proteins in the data set, 554 have no annotation for “functional role”. • We would like to predict their role, how? • Obvious method: interacting partners. But… 29 with partners of common func. 554 unknown 364 with known partner 69 with >1 known partners
Prediction of function • Solution: use the network benefits-second degree neighbors, and so on. • For example, if: -uncharacterized B C A D
vesicular transport vesicular transport vesicular transport vesicular transport membrane fusion Prediction of function-example ? ? ?
summary • Evaluating PPI detection methods reveals unique accuracy, coverage & biases for each method. • There are typical overlaps and complementarities between methods. • PPI networks reveal important information about interaction between protein groups. • PPI networks assist in predicting protein functions.