Download
1 / 21
210 likes | 361 Views
Learn how to interpret velocity vs. time graphs to understand object motion in the negative direction and slowing down. Gain insights into acceleration, velocity changes, and displacement.

E N D
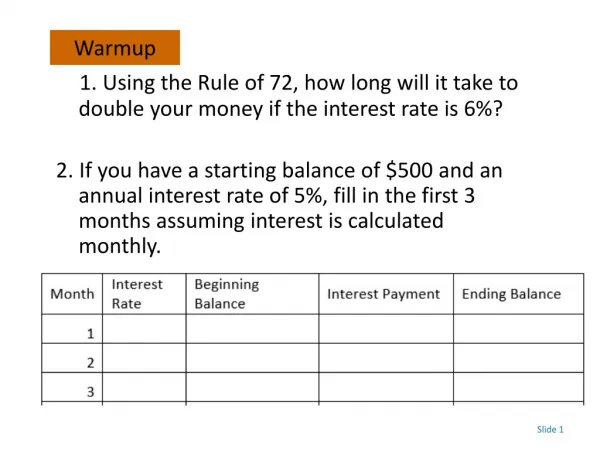
Warmup Question Which position vs. time graph shown below represents the motion of an object that is moving in the negative direction and slowing down?
Narrow it down! • “Moving in the negative direction” • x vs t graph must have a negative slope
“moving in the negative direction and slowing down” • “slowing down” • Velocity and acceleration must be opposite directions • Since velocity is negative, acceleration is positive • Graph must have a positive concavity
Also, try to use the graph to visualize what the object is doing along the x-axis as time ticks by • As time progresses, the object travels less and less distance each second. • Slope approaches zero (object steadily comes to a stop)
Meet the velocity vs time graph v (m/s) cheerio t (s)
The velocity vs time graph is tricky This is because is makes things even more abstract! It is actually graphing the object’s velocity as time ticks by!
Very useful tip: Actually say what the graph represents in words “The object starts out with a velocity of zero, and its velocity steadily becomes more and more positive”
Try it! “The object starts off with a negative velocity, and its velocity steadily becomes closer to zero until finally it has reached zero velocity”
Seriously, putting it into words really helps to understand what the graph is saying “The object starts off with a positive velocity. Its velocity steadily decreases until it has reached zero. The object’s velocity continues to steadily become more and more negative, and it ends up with a negative final velocity.”
Question from 2006 AP Exam 8) What is happening to the car at t = 1 second? (A) It is speeding up. (B) It is slowing down. (C) It is slowing down before t = 1 s and speeding up after t = 1 s. (D) It is speeding up before t = 1 s and slowing down after t = 1 s. (E) It is turning around.
Question from 2006 AP Exam 8) What is happening to the car at t = 1 second? (A) It is speeding up. (B) It is slowing down. (C) It is slowing down before t = 1 s and speeding up after t = 1 s. (D) It is speeding up before t = 1 s and slowing down after t = 1 s. (E) It is turning around.
The slope of the v vs t graph represents the object’s acceleration A car was caught in traffic. After 20 s of moving at constant speed, traffic cleared a bit, allowing the car to speed up. The car’s motion is represented by the velocity-time graph below. What was the car’s acceleration while it was speeding up? (A) 0.5 m/s2 (B) 1.0 m/s2 (C) 1.5 m/s2 (D) 2.0 m/s2 (E) 3.0 m/s2 a = (vf – vi) / (tf – ti)
The slope of the v vs t graph represents the object’s acceleration A car was caught in traffic. After 20 s of moving at constant speed, traffic cleared a bit, allowing the car to speed up. The car’s motion is represented by the velocity-time graph below. What was the car’s acceleration while it was speeding up? (A) 0.5 m/s2 (B) 1.0 m/s2 (C) 1.5 m/s2 (D) 2.0 m/s2 (E) 3.0 m/s2 a = (vf – vi) / (tf – ti)
The total area of the v vs t graph represents the object’s displacement. In this case, Δx = ½ b*h Δx = ½ tf*vf
Remember, the area of a graph can be positive or negative In this case, displacement = total area = positive area + negative area (looks like ≈ 0 m) Positive area (above axis) Negative area (below axis)
The graph above shows an object’s velocity as a function of time. At what time after t = 0 s can the object be found back at its initial position? (A) Between 0 and 1 s (B) 1 s (C) Between 1 and 2 s (D) 2 s (E) Between 2 and 3 s
The graph above shows an object’s velocity as a function of time. At what time after t = 0 s can the object be found back at its initial position? (A) Between 0 and 1 s (B) 1 s (C) Between 1 and 2 s (D) 2 s (E) Between 2 and 3 s “back at its initial position” Δx = 0 When does the total area = 0?
The things that you need to know how to do with the a vs t graph • Use it to describe the object’s acceleration. • Take the area of it to determine the change in the object’s velocity. • Use it to determine the slope of a v vs t graph • Use it to determine when there is a net force exerted on an object/how much force