For environment:
This article explores the concept of ocean stratification, focusing on density variations, static stability, and vertical structure. It also discusses the buoyancy frequency and typical distributions of temperature and salinity in the world ocean.

For environment:
E N D
Presentation Transcript
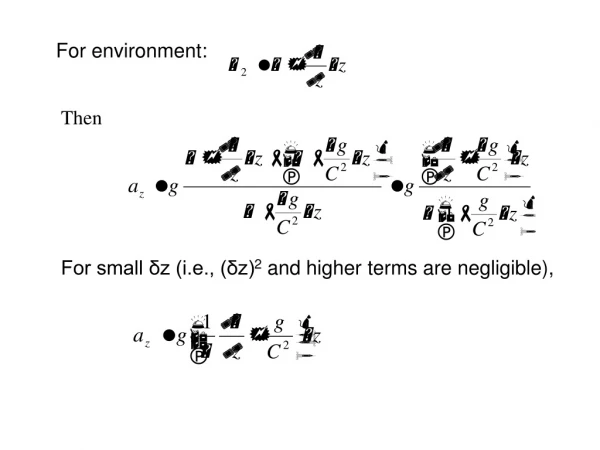
For environment: Then For small δz (i.e., (δz)2 and higher terms are negligible),
Static Stability: Stable: E>0 Unstable: E<0 Neutral: E=0 ( ) , Therefore, in a neutral ocean, . Since E > 0 means, Note both values are negative A stable layer should have vertical density lapse rate larger then the adiabatic gradient.
Г terms: 2 x 10⁻⁸ m-1 (near surface: 4 x 10⁻⁸ m-1) (∂δS,p/∂S) is much smaller than (∂ΔS,T/∂S) (10% at 5000 m and 15% at 10000 m, opposite signs) (∂δT,p/∂T) has the same sign as (∂ΔS,T/∂T), relatively small about 2000m, comparable below). First approximation, , or (reliable if the calculated E > 50 x 10-8 m-1) A better approximation, (σθ ,takes into account the adiabatic change of T with pressure) When the depth is far from the surface, σ4=σS,θ,4(p=40,000kPa=4000dbar) may be used to replace σθ.
In practice, E≈ -25 ~ -50 x 10-8 m-1 in upper 50 m. a) mixed layer is slightly unstable subtropics, increase of salinity due to evaporation, vertical overturning occurs when E ~ -16 to -64x10-8 m-1, because of the effects of heat conduction, friction, eddy diffusion, etc. b) observational errors Error of σt ~ 5 x 10⁻³ The error of σt at two depths Δσt ~ 10-2 for Δz=z1-z2=20 m.
Buoyancy frequency (Brunt-Väisälä frequency, N) We have known that ,(depending on δz, restoring force) Since δz is the vertical displacement of the parcel, then or Its solution has the form where (radians/s)2 N is the maximum frequency of internal waves in water of stability E. Period: E=1000 x 10-8 m-1, τ=10 min E=100 x 10-8 m-1, τ=33 min E=1 x 10⁻⁸ m-1, τ≈6hr
Typical Distributions of Water Characteristics in the Oceans
Ocean Mean State Sea Surface Properties Vertical Structure Thermocline
Global Statistics • The mean temperature of the world ocean is 3.5oC and the mean salinity is 34.7. (Even at the equator the average temperature is as low as 4.9°C). • 75% of the total volume of the ocean water has properties within the range from 0o to 6oC in temperature and 34 to 35 in salinity. • 50% of the total volume of the oceans has properties between 1.3oC and 3.8oC and between 34.6 and 34.8. • Both temperature and salinity are quite uniformly distributed below 1000 m depth. Volumetric temperature-salinity diagram of the world ocean. 75% of the ocean's water have a temperature and salinity within the green region, 99% have a temperature and salinity within the region colored in cyan. The warm water outside the 75% region is confined to the upper 1000 m of the ocean. From M. Tomczak, 1996: Introduction to Physical Oceanography (http://gaea.es.flinders.edu.au/~mattom/IntroOc)
Mean Sea Surface Temperature (SST) • roughly zonal (east-west) isotherm • meridional gradient follows solar radiation • diverted north-south near the eastern coast (cold tongues) • warm pool: SST > 28oC • sea ice at high latitudes (near -2oC) CPC Analysis, January 1982-December 2001
NODC WOA98, levitus et al Mean Sea Surface Salinity (SSS) • SSS distribution is mostly zonal (range: 33-37) • Minimum north of the equator (ITCZ) • Maximum in subtropics (trade winds) • Lower around coast (river) and polar region (melting ice) • Mediterranean, 39 and Red Sea, 41 (large evaporation )