Download
1 / 23
230 likes | 370 Views
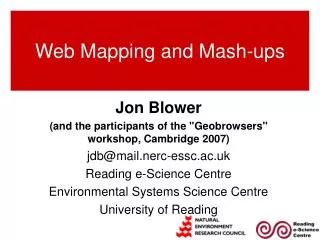
Web Mapping and Mash-ups. Jon Blower (and the participants of the "Geobrowsers" workshop, Cambridge 2007) jdb@mail.nerc-essc.ac.uk Reading e-Science Centre Environmental Systems Science Centre University of Reading. Web 1.0: the Old World.

E N D
Web Mapping and Mash-ups Jon Blower (and the participants of the "Geobrowsers" workshop, Cambridge 2007) jdb@mail.nerc-essc.ac.uk Reading e-Science Centre Environmental Systems Science Centre University of Reading
Web 1.0: the Old World Users might have to visit many websites to get their job done Separate websites for each provider of data or functionality Each website is a “dead end”
The Brave New World Different communities can combine data and functionality in their own way ? Data and functionality exposed through Web Services Web Services Web Services Web Services
What are mash-ups and what do they do? Combinations of data and/or functionality from more than one independent source to create a new application or reveal new information • Foster creativity • Doesn’t rely on one provider thinking of everything! • Lower the cost of application development and information discovery • Easy to use! • Lightweight Geographic Information Systems
A Search and Rescue mash-up • ESSC and BMT Cordah Ltd • Use Google Earth as common platform for visualizing: • Ocean forecast data (from UK Met Office) • SAR predictions (from BMT software) • Can see path of drifting person and sea temperature, animated simultaneously • Could also bring in wind data, shipping lanes etc
Web Mapping • ICEDS • Integrated CEOS European Data Server • UCL and ESYS plc • Displays global and continental-scale, full-resolution geographic information • Web interface (left) • Brings together land surface satellite imagery, bathymetry, up-to-date clouds • Direct access to map images and data • Through standard Web Service interfaces http://iceds.ge.ucl.ac.uk/
Desktop vs Web mash-ups Web sites E.g. Godiva2, ICEDS Users only need a web browser 2D visualization Web site provider controls the datasets users can see Can create custom functionality Desktop apps Google Earth, Microsoft Virtual Earth "Virtual Globes" 3D visualization Easy to incorporate new datasets E.g. Via KML files Often can't add new functionality Lots of overlap! Many data formats can be read by both.
Reveal spatial patterns • Visualize species distribution alongside 3D rendering of topography • Google Earth again! • Can see that the waxy earwort (Douinia ovata) seems to prefer valley environments • National Biodiversity Network • Jonathan Cooper, CEH http://www.brc.ac.uk/GoogleEarth/NBNGoogleEarth.jsp
Visualization of scientific phenomena • Hurricane Katrina, August 2005 • Picture left shows sea surface temperature (UK Met Office) and storm position/intensity (TRACK analysis of ECMWF data) • Winds cause upwelling of cooler subsurface water on right-hand side of the cyclonic storm track • (much more obvious in live system!)
Direction of missions with real-time data • British Antarctic Survey (BAS) used Google Earth to direct 2 scientific cruises in 2006 • Multiple data streams (ship location, sea temp and salinity, air temp and pressure) streamed to Google Earth in near real time • Combined with info about wider environment • Enabled real-time decision-making (e.g. tracking of predators, left) King penguin track overlain with concurrent chlorophyll and satellite imagery
Diagnosis of models and observations • Picture left shows comparison of NEMO model and observations for Nov 2004 • Red dots show bad model-obs fits, green dots are good fits • Google Earth allows very efficient browsing of these large datasets • Could read obs and model data from different locations and bring together in Google Earth or another client • Requires some server-side functionality
Combining web mapping with virtual globes: Godiva2 Displays dynamically-generated images of environmental data on a website Acts as an interactive, 4-D online visualization system to allow the user to explore data and find interesting features. Then user can view the data in Google Earth and combine with other datasets http://lovejoy.nerc-essc.ac.uk:8080/ncWMS/godiva2.html
… as a user • Download Google Earth and play! • Visit some links to find out what others are doing: • Geobrowsers workshop: www.niees.ac.uk/events/GoogleEarth • Online community: www.scispace.net/geobrowsers • Example data available in Google Earth (KML) format: • CASIX database • Lots of US weather data • MCA hydrographic surveys • EarthNC marine charts (NOAA) • National Biodiversity Network • Use your imagination! What would you like to see happen? • Post a message to the Geobrowsers community or send me an email!
… as a data provider • Different levels of effort depending on what you want to achieve: • (1) Provide locations of your data in a simple format (e.g. GeoRSS) and display on the Web using Google Maps or Worldkit. • (2) Link the data points to your website for more information • (3) Convert some data to Google Earth (KML) format and put on your website. Allow Google to find these files automatically (instructions available on the web). • (4) If you have large data sets, consider generating KML dynamically through a Web Service, allowing users to choose the data they see • (5) Put up standard Web Services (e.g. Web Map Service, Web Feature Service) • Important to use standard data formats where possible!
Useful Web Services that provide common geographic functions • Geocoding (Yahoo, Google) • Convert addresses to lat-lon • Gazetteer (lots, e.g. Gaze) • Converts town, country names, IP addresses to lat-lon • Disambiguates names • Can envisage many more generic services • Coordinate transformations • Data format conversion (e.g. GeoRSS -> KML) • Yahoo Pipes allows you to string these things together in an online workflow: • E.g. picture right: find apartments in San Francisco near a park • Display on a dynamic web map • Then export as KML
Discussion: the future • Increased uses of these technologies in education and outreach • Move beyond visualizations to data manipulation • Through creative use of Web Services and distributed computing • More scientific datasets made available through Google Earth etc • Have started the ball rolling with "Google Ocean": in progress • Better discovery of available data through catalogues • Google Earth can be a good discovery interface • Can EDINA play a role here? • Just being able to discover and preview data simply would be a great step forward! • Security • How to secure data streams whilst not losing compatibility? • Please join online community at www.scispace.net/geobrowsers! • Share datasets, hints, experiences, applications, ask for help…
Thank you! (the next few slides give useful references to key technologies that you might like to investigate…)
Reference: key Web Mapping technologies • Google Maps, Yahoo Maps, Microsoft Virtual Earth • Free but closed-source systems for dynamic web mapping • OpenLayers: • Open-source web mapping application, interacts with standard web services • WorldKit: • Very simple web mapping toolkit, Flash-based • Web Map Service implementations: • UMN Mapserver • Geoserver • ncWMS • Web Feature Service implementations: • Geoserver • … (THAT RESTful thing that's easy to use apparently)
Reference: Virtual Globes • Google Earth • Closed source, easy to use • Data ingested through KML • NASA World Wind • Open source, NASA-oriented • ArcGIS Explorer • Free, but works best when linked to ArcGIS Server (non-free!) • Microsoft Virtual Earth 3D • Many more!
Reference: useful data formats for mash-ups • GeoRSS • Very simple way to geo-locate a piece of information • Can be displayed by Google Maps, OpenLayers, WorldKit, more… • KML (Keyhole Markup Language) • Google Earth's format, but can be read by many other GIS applications, web and desktop • Combines geo-location with Styling • Geography Markup Language (GML) • More complex but rich • The output from a Web Feature Service • GeoTIFF • "A picture that knows where it is" • Can't be displayed by most web browsers without a plug-in • Can also contain data • GIF, PNG, JPEG • Don't contain geolocation information but can be displayed on the Web • The output from a Web Map Service