Download
1 / 51
550 likes | 788 Views
Mapping and Monitoring of Snow Cover from Satellites. Peter Romanov Associate Research Scientist University of Maryland, USA. My Short Bio. Education MA from Sankt-Petersburg (Leningrad) State University Ph.D. from Central Aerological Observatory (Moscow) Professional Employment

E N D
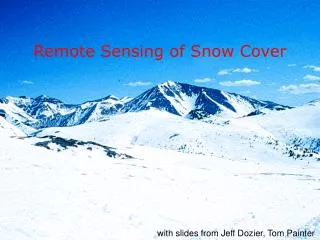
Mapping and Monitoring of Snow Cover from Satellites Peter Romanov Associate Research Scientist University of Maryland, USA
My Short Bio Education • MA from Sankt-Petersburg (Leningrad) State University • Ph.D. from Central Aerological Observatory (Moscow) Professional Employment • Hydrometcenter of USSR-Russia • Universite de Sherbrooke, Canada • NOAA/NESDIS, University of Maryland, USA, since 1998 Major focus areas • Automated techniques for satellite remote sensing • Use satellite data for climate studies
Outline • Snow cover: applications and requirements • Remote Sensing Basics • Satellites and sensors • Snow detection and mapping techniques • Validation of satellite snow maps • Examples of application • Summary
Snow Cover: Facts • Seasonal and perennial • Seasonal snow extent • NH: over 40 mln km2 (70% of the area) • 100% boreal zone • SH: about 1mln km2, (mostly South America) • Needed for or used in • Weather prediction • Hydrology • Climate studies • Environmental Applications, Agriculture, Fire control • Transportation, Recreation, Power Generation • Health, etc.
Info on Snow Cover: Requirements • Global Climate: Daily-Weekly, ~50 km resolution • NWP: Daily, <10-20 km resolution • Hydrology: Daily, ~1-2 km resolution • Glaciers: Yearly, ~10-100 m resolution • For NWP and climate models global or continental continuous coverage is needed • Surface observations are insufficient, satellite data should be used
Remote sensing: involves measurements of electromagnetic radiation emanating from the earth/atmosphere system
Satellites: polar (low-) orbiting and geostationary Polar Repeat coverage 12 hours Global coverage Varying viewing angle Visible, infrared, microwave Geostationary Repeat coverage 15-30 min Full earth disk only, no polar areas Same viewing angle Visible, infrared
Satellite Snow Detection and Mapping Techniques: General Essence of snow-mapping is satellite image interpretation Sensing method: Passive or active Spectral band: Visible/infrared or microwave Spectral information: Single band or multispectral Automation: Interactive or automated Active methods use only microwave band (radar) Interactive techniques are typically single band-based Combination of VIS/IR and microwave is possible
Satellite-based snow mapping techniques • Interactive • Visible imagery • Snow extent • Automated • Microwave • Snow extent • Snow depth, Snow-water equivalent • Visible/middle-infrared/infrared • Snow extent • Snow fraction • Snow depth
NOAA INTERACTIVE MULTISENSOR SNOW AND ICE MAPPING SYSTEM (IMS) 35+ years of mapping snow and ice over Northern Hemisphere Satellite imagery in the visible band Imagery examined by human analysts “Intelligent guess” is used if cloudy Maps are drawn by hand and digitized Maps are incorporated in all NOAA operational NWP models Cover Northern Hemisphere In the past (1972-1999) Paper technology Polar orbiting satellites only Weekly, 180 km spatial resolution On the Web: http://www.ssd.noaa.gov/PS/SNOW/index.html
CURRENT IMS SYTEM (since 1999) Computerized system (image analysis and map drawing) Geostationary satellite data added Extensive use of loops of satellite imagery (movie-loops) Daily Production 25 km spatial resolution 4 km resolution since 2004 Maps are digital On the Web: http://www.ssd.noaa.gov/PS/SNOW/index.html
ROSHYDROMET SNOW MAPS Polar orbiting satellites Daily Production Russia only Contour only Map is not digitized On the Web: http://planet.iitp.ru/english/index_eng.htm
PLUSES AND MINUSES OF INTERACTIVE SNOW MAPPING Subjective Substantial workload Hard to utilize full potential of satellite data High spatial resolution Multispectral measurements But Simple logic, easy to implement Short training period of analysts Product is implicitly quality controlled (no obvious mistakes) NOV 26, 2005 Snow cover over Iberian peninsular for two consequtive days as mapped by IMS NOV 27, 2005
Yearly average snow extent 35-year time series is a good material for climate change studies NOAA interactive analysis data (IMS)
Monthly average snow extent. North America Trends in the monthly snow extent 1972-2005 Largest trends are in summer, hence strongest changes are in the Arctic region. Similar trends are observed over Eurasia
Why Automated ? • Reduce human workload • Objective classification, consistent in time retrievals • Historical data can be reprocessed • Temporal and spatial resolution is limited only by instrument/satellite capabilities
Automated Techniques • - Passive microwave (MW) • (10GHz-100GHz) • Snow/Ice extent • Ice concentration • Snow depth • Snow-water equivalent • - Visible/middle-infrared/infrared (VIS/IR) • (0.6μm/1.6μ-3.9μm/11μm) • Snow/Ice extent • Snow/ice fraction • Snow depth • Snow cover temperature • Active microwave • Ice extent, concentration • Snow freeze/thaw identification
Automated satellite image classification methods Clustering Minimum distance Maximum likelihood Neural networks However most popular is a decision-tree threshold-based method since it is Easy to understand Easy to develop and implement Fast Robust Example of a decision-tree algorithm
Automated snow detection in the visible/infrared spectral range: basics Uses sharp drop of snow reflectance from visible (VIS) to shortwave infrared (SIR) spectral band Needs observations in - visible - shortwave infrared - infrared Advantages - High spatial resolution of satellite sensors Drawbacks - Works when cloud-clear - Needs daylight Snow spectral properties in the visible and infrared
Ch. 1 Ch. 2 Ch. 3A Ch. 3B Ch. 4 Ch. 5 Central Wavelength (μm) 0.6 0.9 1.6 3.7 10.8 12.0 Resolution (km) 1.1 1.1 1.1 1.1 1.1 1.1 Temperature Range (K) 180 – 335 180 – 335 180 - 335 AVHRR/NOAA instrument AVHRR: Advanced very High Resolution Radiometer NOAA: National Oceanic and Atmospheric Administration
Other satellite instruments used or can be used for snow monitoring in the visible/infrared • Sensor/satellite Type Spatial Revisit Number of resolution period satellites • AVHRR/NOAA * polar 1-4 km 1 day 3 • MODIS/EOS * polar 0.25-1 km 1 day 2 • Vegetation/Spot polar 1 km 1 day 1 • TM/Landsat polar 30 m 8 days 1 • Imager/GOES * geo 1-4 km 30 min 2 • SEVIRI/Meteosat-8 * geo 1-3 km 15 min 1 • MTSAT geo 4 km 30 min 1 • Snow maps are routinely generated • Data from some other sensors capable of snow • identification and mapping are not publicly • available (India, China)
Practical separation of snow from land and clouds in VIS/SIR/IR • Very simplified since • Reflectance depends on geometry of observations • Surface reflectance changes with surface type • Snow reflectance depends on snow physical properties • Vegetation tends to mask snow cover Dense vegetation Typical criteria to identify snow R0.6 > R0.6T R1.6 < R1.6T T11< T11T T means threshold value Other spectral features used in snow detection NDSI=(R0.6-R1.6)/(R0.6+R1.6) : snow index NDVI=(R0.9-R0.6)/(R0.9-R0.6) : vegetation index
MODIS snow map MODIS: Moderate Resolution Imaging Spectroradiometer Primary spectral features used: NDSI= (R0.6-R1.6)/(R0.6+R1.6) NDVI= (R0.6-R0.9)/(R0.6+R0.9) T11 NDSI: Normalized Difference Snow Index NDVI: Normalized Difference Vegetation Index T11: Infrared brightness temperature at 11 µm • Features: • Automated technique • Global • Daily (non-operational) • 1 km resolution • Available since 2000 MODIS daily snow map
MODIS 8-day snow map Reports frequency of occurrence of snow, land and clouds within 5 km grid cells
AVHRR: Advanced Very High Resolution Radiometer NOAA: National Oceanic and Atmospheric Administration AVHRR/NOAA daily snow map RGB composited image Red: R1.6 Green: R0.6 Blue: T11 (inverted) Snow and ice appear in light green color Algorithm features Automated Operational at NOAA Daily Global coverage 4 km resolution NDSI, NDVI, T11 Daily snow map. Snow is white, ice is yellow, clouds are gray
Fraction of cloud-covered area in daily global MODIS snow maps On the average about 43% of all land area is classified as cloud-clear Over areas where seasonal snow is possible cloud-clear fraction decreases to 38% Combining cloud clear observations from two MODIS instruments (Terra and Aqua) allows to increase cloud-clear area by ~8%
IMS & MODIS daily mapped snow cover area North America Snow extent estimated from NOAA Interactive (IMS) snow map MODIS area of mapped snow cover (not obscured by clouds)
Snow mapping with geostationary satellites Advantages Multiple daily observations allow for effective reduction of cloud amount in the map (image compositing) Temporal variability of scene temperature and reflectance may be used to better identify clouds Limitations Coverage is determined by satellite position Coverage is limited to up to 65N and S Large satellite zenith angles over high latitudes (increased cloud contamination and atmospheric scattering) Example of snow map derived from Meteosat-8/SEVIRI data
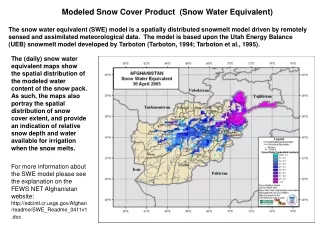
EFFECT OF MAX TEMPERATURE IMAGE COMPOSITING Derived from a daily composited image Derived form a single image (no compositing) Automated Meteosat-8 SEVIRI-based snow map (White: snow, Grey: clouds) Daily Image compositing reduces cloud contamination and provides an improved area coverage MODIS snow map (Green: land, Red: snow, Light blue: clouds) SEVIRI: Spinning Enhanced Visible and InfraRed Imager
OTHER SNOW CHARACTERISTICS THAT CAN BE DERIVED FROM VIS/IR OBSERVATIONS Fractional snow cover
On the Web: http://orbit-net.nesdis.noaa.gov/crad/sat/surf/snow/HTML/fraction.htm Snow fraction Tree cover fraction - GOES Imager data - Sub-pixel snow fraction - Based on visible reflectance - Linear mixture approach GOES: Geostationary Operational Environmental Satellite
GOES: SNOW FRACTION Daily snow fraction map Maximum snow fraction for seasonally snow covered areas • Sub-pixel snow fraction • Presents the fraction of snow cover seen from the above (not masked by trees) • Based on observed visible refletctance • Needed to estimate the land surface albedo • Linear mixture approach used: F = (Robs - Rland) / (Rsnow - Rland) On the Web: http://www.orbit.nesdis.noaa.gov/smcd/emb/snow/HTML/fraction.htm
Mar, 14 Mar, 15 Mar, 16 Mar, 17 Mar, 18 Mar, 19 Mar, 20 Mar, 21 Mar, 25 Mar, 24 Mar, 22 Mar, 23 GOES: SNOW TEMPERATURE Temperature of snow-covered surface: Year 2003 Snow-free land Cloudy TEMPERATURE OF SNOW-COVERED LAND SURFACE
GOES: SNOW DEPTH Snow depth is derived from the visible reflectance using and empirically established relationship. Estimates can not be made over dense forest. Light gray: clouds Dark gray: densely forested area Retrieval accuracy: ~30% for snow depths up to 30 cm, and ~50% up to 50 cm On the Web: http://www.orbit.nesdis.noaa.gov/smcd/emb/snow/HTML/dd.htm
Snow detection in the microwave: basics Spectral range from 9GHz to 100GHz (3 cm to 0.3 cm) • Dry snow grains scatter upwelling radiation • Scatter increases with increasing frequency • Scatter increases with the depth of snow pack • Increased scatter decreases emissivity and brightness temperature • Hence: Spectral gradient of observed brightness temperature is indicative of snow cover and sensitive to snow depth • or snow water equivalent (SWE)
Snow detection in the microwave: advantages and limitations Most clouds are transparent in the microwave Daylight is not needed But Shallow snow (below 5-10 cm) is practically transparent in the microwave Wet melting snow is hard to detect Cold rocks easily confused with snow (they also scatter) Spatial resolution is much lower than for VIS/IR
Channels 1,2 3 4,5 6,7 Central Frequency (GHz) 19.3 22.2 37.0 85.5 Radiometric Pol. (V/H) V ,H V V ,H V, H Thermal resolution (K) 0.8 0.8 0.6 1.1 Fiold of View (Km) 70 x 45 60 x 40 38 x 30 16 x 14 SSM/I DMSP instrument SSMI: Special Sensor Microwave Imager DMSP: Defense Meteorological Satellite Program Scanning geometry
Satellite and sensors used for snow mapping in the microwave Sensor/satellite Type Spatial Revisit Number of resolution period satellites AMSU/NOAA * polar 50 km 1 day 3 AMSR-E/Aqua * polar ~25 km 1 day 1 SSMI/DMSP* polar ~30 km 1 day 3 * Snow maps are routinely generated Spatial resolution of spectral channels decreases with decreasing frequency
Examples of microwave daily snow products AMSR-E Aqua Snow water equivalent NASA product 25 km resolution AMSU NOAA Snow water equivalent NOAA product 50 km resolution Common features of microwave snow products: - Underestimate snow cover and snow depth in autumn (shallow snow) - Underestimate snow cover in spring (melting snow) - Overestimate snow cover over mountains (confuse with cold rocks) - Accuracy of snow depth estimates is poor (~50-80% error)
Combining snow retrievals in VIS/IR and microwave Motivation: Generate continuous (with no gaps) snow map on a daily basis at highest possible spatial resolution and accuracy Basic idea: Complement vis/IR observations when dark or cloudy Approach: Combine products (snow maps) derived with different techniques Microwave AMSR-E Aqua MODIS Aqua Vis/IR Combined snow map
NOAA Multisensor Automated Snow and Ice Mapping System Combines observations from 8 polar orbiting and geostationary satellites Uses both vis/IR and microwave retrievals Daily production 4 km nominal resolution Operational Data from satellite instruments used Imager/GOES-10 and -12 (geo) SSMI/DMSP-13,14,15 (polar, microwave) SEVIRI/MSG (geo) AVHRR/NOAA-17, 18 (polar, vis/IR) http://www.orbit.nesdis.noaa.gov/smcd/emb/snow/HTML/multisensor_global_snow_ice.html
How do satellite-based snow maps compare ? Interactive vs automated snow cover Green: Both land Blue: Both snow Red: Interactive: land, automated: snow Yellow: Interactive: snow, automated: land Overall interactive and automated snow maps agree over 93 to 98% of the area Agreement is 5%-15% worse if only one type of data is used (vis/IR or microwave)
Total snow extent estimated from multisensor auto and interactive product. Northern Hemisphere Difference in snow extent estimate Daily : within 5% November to May Yearly : about 1%
Remote Sensing Basics: Radiation • Plank Function: B(λ,T)=2hc2/[λ5(exp(hc/λkT)-1)] B: spectral radiance of black body [W/m2·ster·cm], T: Brightness temperature [K] λ: wavelength [m] • Emissivity: ελ=Eλ/Bλ Eλ:actual emitted radiance • Reflectance: rλ=Rλ/Iλ Rλ: reflected radiance Iλ: incident radiance • For opaque surface in thermal equilibrium: rλ=1-ελ
Satellite instruments applicable for snow identification and mapping LEO (polar-orbiting) GEO Vis/IRVis/IR AVHRR/NOAA MTSAT MODIS/EOS SEVIRI/MSG Vegetation/SPOT Imager/GOES TM/Landsat Passive Microwave SSMI/DMSP AMSR-E/Aqua