Download
1 / 31
320 likes | 519 Views
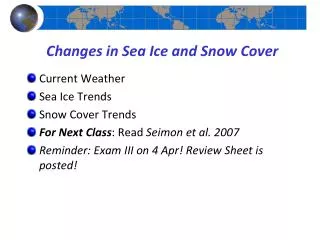
Changes in Sea Ice and Snow Cover. Current Weather Sea Ice Trends Snow Cover Trends For Next Class : Read Seimon et al. 2007 Reminder: Exam III on 4 Apr! Review Sheet is posted! . Sea Ice. Photo credit: William & Mary Va. Institutue of Marine Science. Sea Ice.

E N D
Changes in Sea Ice and Snow Cover • Current Weather • Sea Ice Trends • Snow Cover Trends • For Next Class: Read Seimon et al. 2007 • Reminder: Exam III on 4 Apr! Review Sheet is posted!
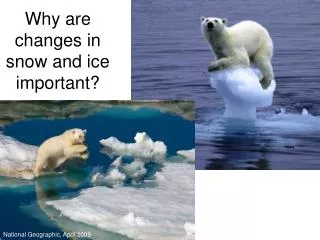
Sea Ice Photo credit: William & Mary Va. Institutue of Marine Science
Sea Ice • Why do we care about sea ice trends? • Why is sea ice important from a climate science perspective?
Sea Ice Extent Annual Anomalies Major reductions in sea ice extent in NH! Slight increases in SH
September 1999 March 2000
September 2011 March 2012
Arctic Sea Ice Extent from Satellite Data Median ice edge NASA and NSIDC
Arctic Sea Ice Extent from Satellite Data NASA and NSIDC
Melting of sea ice dramatically changes the energy balance in the Arctic Ocean Sun solar radiation 45 – 95% reflected sea ice 85 – 95% absorbed ocean Credit: C.L. Parkinson / NASA / GSFC
Perennial or Multi-Year Sea Ice • Perennial sea ice has been decreasing at a greater rate than has total sea ice in the Arctic • More first-year sea ice means that it’s easier to melt each year because it’s thinner
Near-Minimum Sea Ice Extent -- 2012 SVS GSFC/ NASA
Minimum Multi-Year Sea Ice Extent -- 2012 Multi-Year Sea Ice Russia Greenland Alaska Canada J.C. Comiso / NASA
Sea Ice Videos • http://www.youtube.com/watch?v=Co68_tod0dQ • http://www.youtube.com/watch?v=6j8SGs_gnFk
Recent Sea Ice Trends • Recent years have seen the downward trends in sea ice extent continue for the Arctic. • Higher summer temperatures, changing wind/ocean currents • Less multi-year (i.e., thick!) ice remaining • Slight increases in sea ice extent are evident in the Antarctic. • More precipitation (snow and rain = decreased salinity of ocean water which raises its freezing point?) • More snow during autumn freeze up which allows ice to form more quickly?
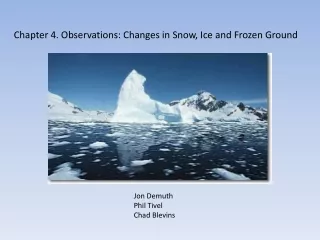
Seasonal Snow Cover Photo credit: D.K. Hall / NASA
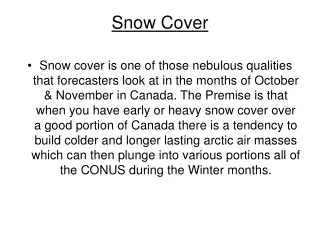
Snow and Climate • Snow covers over 40% of the Northern Hemisphere land surface in a typical winter • High albedo and heat capacity of snow cover influence energy exchange with the atmosphere • Can lower temperatures over large areas • Influences regional weather patterns and monsoon strength • Additionally, snow cover represents a key indicator of climate change
Satellite Snow-Cover Products Feb. 2004 28 Dec. 2010 MODIS monthly snow-cover map Northeastern U.S. MODIS swath fractional snow-cover map National Ice Center (NIC) snow-cover map IMS 12 Feb. 2012
Snow in North Carolina 14 February 2010 Cape Hatteras Harkers Is. MODIS Rapid Response Team
Snow in the Sierra Nevada, Calif. 1 October 2004 NASA/MODIS
Snow Cover in North America Sept. 2002 – Jun. 2003 North Carolina MODIS SVS / NASA
Northern Hemisphere monthly average snow extents for the past three decades* *compared the long term average D. Robinson / Rutgers Univ.
Snow-covered area derived from station data (before 1972) and NOAA satellite data (after 1972); the smooth curve shows decadal variations (from Brown, 2000).
1988-2004 period was characterized by warmer NH spring conditions and earlier snowmelt
NH Snow Cover extent has been well above normal the past three winters! Especially over the mid-latitudes (35-55 N). Possibly related to the Warm Arctic Cold Continents pattern (Cohen 2010) discussed previously.