Download
1 / 6
60 likes | 183 Views
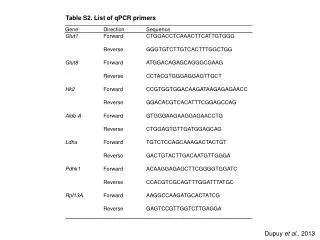
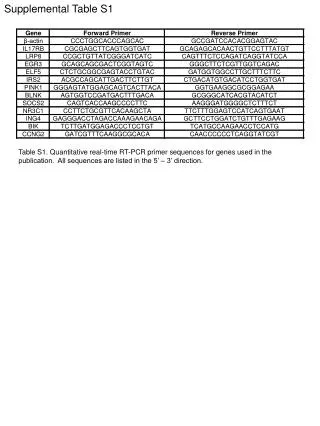
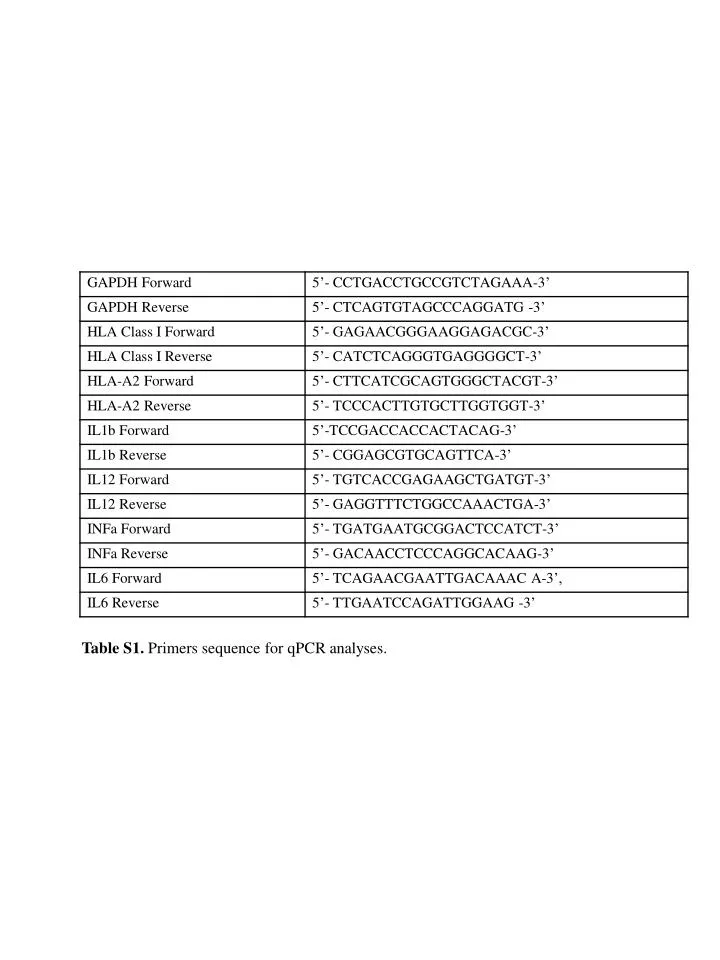
Table S1. Primers sequence for qPCR analyses. FIGURE S1. 4. 3.5. 3. 2.5. Surface HLA class I Fold increase relative to untreated. 2. 1.5. 1. 0.5. 0. 15 min. 30 min. 1 h. 2 h. 3 h. 4 h. 6 h. 24 h. 48 h. 72 h. Time.

E N D
FIGURE S1 4 3.5 3 2.5 Surface HLA class I Fold increase relative to untreated 2 1.5 1 0.5 0 15 min 30 min 1 h 2 h 3 h 4 h 6 h 24 h 48 h 72 h Time Fig. S1. Effect of EpoB on surface HLA Class I expression in Hey cells. Cells were treated with 20 nM EpoB for shorter periods of time (15 min to 72 h). Level of surface HLA Class I was determined by flow cytometry. One representative experiment is shown.
FIGURE S2 24 h 48 h 72 h Surface HLA Class I expression in OVCAR-Epo10. Fold increase relative to untreated. 5 10 20 50 Fig. S2. Effect of EpoB on surface HLA Class I expression in EpoB-resistant ovarian cancer cell line. OVCAR-Epo10 cells were treated with indicated concentrations of EpoB for 24, 48 and 72 h and level of HLA Class I was determined by flow cytometry. Each value is the mean of four independent experiments. EpoB (nM)
FIGURE S3 Surface HLA Class I expression in SKOV-3. Fold increase relative to untreated 5 10 20 50 100 EpoB (nM) Fig. S3. EpoB does not alter surface HLA Class I expression in the ovarian cancer cell line SKOV-3. Cells were treated with the indicated concentrations of EpoB for 72 h and HLA Class I level was determined by flow cytometry. Each value is the mean of two independent experiments.
FIGURE S4 48 hrs 72 hrs Surface HLA Class I expression in SK-MEL-3. Relative to untreated. 5 10 20 EpoB (nM) Fig. S4. Effects of EpoB on surface HLA Class I expression in melanoma cell line, SK-MEL-3. Cells were treated with the indicated concentrations of EpoB for 48 and 72 h, followed by flow cytometry. One representative experiment is shown.
FIGURE S5 A 24 hr EpoB ‘conditioned media’ Surface HLA Class I expression B Fig. S5. Surface HLA Class I increase was mediated by soluble factors generated by EpoB-treated cells.(A)Hey cells were treated with 20 and 50 nM EpoB for 24 h. Media from treated cells (‘conditioned media’) was transferred into a new cell culture. 72 h after media transfer, recipient cells were washed and surface HLA Class I expression was assessed by FACS. As comparison, a separate culture was treated with fresh EpoB for 72 h, and HLA Class I expression was assessed at the same time (B). Each value is the mean of two experiments.