Download
1 / 23
230 likes | 244 Views
This chapter explores the estimation of population characteristics, such as occupancy rate, number of customers, delivery times, and more. It discusses point estimates, interval estimates, and confidence interval estimates.

E N D
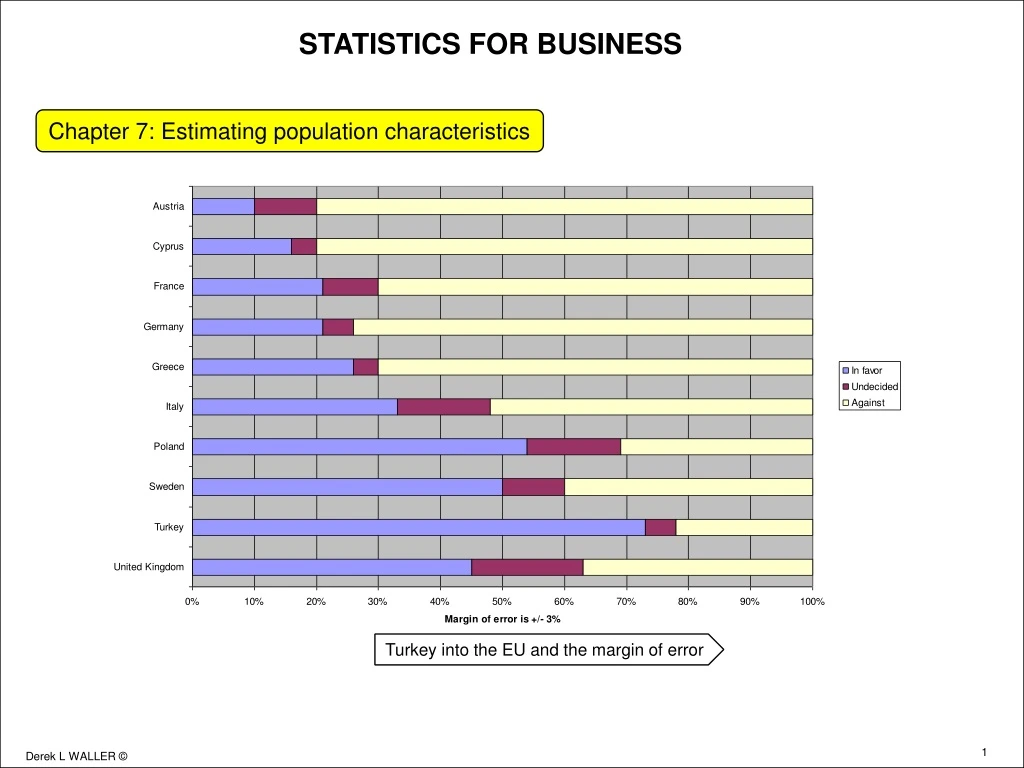
STATISTICS FOR BUSINESS Chapter 7: Estimating population characteristics Turkey into the EU and the margin of error
STATISTICS FOR BUSINESS (Estimating population characteristics) Turkey and the margin of error Hotels estimate occupancy rate for revenue management Restaurant estimates number of customers for food planning Suppliers estimate delivery times for food and beverages Project managers estimate time to complete projects Investors estimate future stock prices Editors estimate sales of a new book Business schools estimate future enrollment for budget purposes Pedestrian estimates the speed of a car when crossing the street R&D departments estimate time for developing new “products”
STATISTICS FOR BUSINESS (Estimating population characteristics) Turkey and the margin of error ESTIMATOR The sample statistic used to estimate the population parameter Sample mean, x-bar can be an estimator of the population mean, µ Sample standard deviations, s, can be an estimator of the population standard deviations s Sample proportion p-bar, can be an estimator of the population proportion, p ESTIMATE The specific observed value of the statistic From a sample, the average room price of a hotel in a certain city is €105. The estimate is that the average price of all hotels in this city is €105.
STATISTICS FOR BUSINESS (Estimating population characteristics) Turkey and the margin of error Estimating the mean value – point estimates Here a single sample statistic is used to “estimate” the true population parameter Sample mean is a point estimate of population mean Example: A sack of green coffee beans weighs 10 kg: Assumption is that all sacks weigh 10 kg Point estimates are insufficient; they are either right, or wrong. Better to give a range for the estimate since estimating with a single value lacks credibility
STATISTICS FOR BUSINESS (Estimating population characteristics) Turkey and the margin of error INTERVAL ESTIMATES This is a range of values used to estimate a population parameter: I estimate that the number of customers tomorrow in my restaurant will be between 30 and 40 By linear interpolation point estimate would be 35 Even better to give the probability estimate of true population parameter lying within range Thus: I estimate that there is an 85% probability that number of customers will fall in this range 30 to 40
STATISTICS FOR BUSINESS (Estimating population characteristics) Turkey and the margin of error What is the probability of a population parameter falling within an interval estimate? A large international hotel chain wants information of its average daily revenues/client. Random sample of 100 clients taken; mean revenues, converted to Euros, is €200/day POINT ESTIMATE: Mean daily revenues is €200 What about certainty of this information? Hotel knows from past revenue data that population standard deviation is €40/day
STATISTICS FOR BUSINESS (Estimating population characteristics) Turkey and the margin of error • Using quantitative characteristics of Normal distribution • We know that 68.27% of data lies between ± 1 standard deviation of mean . From the transformation formula for sampling: • Thus best estimate is that mean daily revenues per client are €200 • Manager is 68.27% confident that the mean revenues are in the range €196.00 to €204.00 • Confidence interval estimates are €196.00 and €204.00 • Confidence range is €8.00
STATISTICS FOR BUSINESS (Estimating population characteristics) Turkey and the margin of error • Using quantitative characteristics of Normal distribution • We know that 95.45% of data lies between ± 2 standard deviation of mean . From the transformation formula for sampling: • Thus best estimate is that mean daily revenues per client are €200 • Manager is 95.45% confident that the mean revenues are in the range €192.00 to €208.00 • Confidence interval estimates are €192.00 and €208.00 • Confidence range is €16.00
STATISTICS FOR BUSINESS (Estimating population characteristics) Turkey and the margin of error • Using quantitative characteristics of Normal distribution • We know that 99.73% of data lies between ± 3 standard deviation of mean . From the transformation formula for sampling: • Thus best estimate is that mean daily revenues per client are €200 • Manager is 99.73% confident that the mean revenues are in the range €188.00 to €212.00 • Confidence interval estimates are €188.00 and €212.00 • Confidence range is €24.00 • Note the higher the confidence level, greater is the confidence interval estimate • 68.27% confidence range is €8.00 • 95.45% confidence, range is €12.00 • 99.73% confidence, range is €24.00
STATISTICS FOR BUSINESS (Estimating population characteristics) Turkey and the margin of error Confidence interval estimates Here, samples 3 and 6 Do not contain population mean 95% confidence interval estimate Implies that if all possible samples Were taken, about 95% of them Would include true population mean And 5% would not µ Interval for sample N° 3 Interval for sample N° 4 Interval for sample N° 1 Interval for sample N° 2 Interval for sample N° 6 Interval for sample N° 5
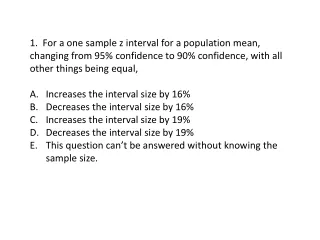
STATISTICS FOR BUSINESS (Estimating population characteristics) Turkey and the margin of error Confidence intervals and mean value • Use Normal distribution when: • Population standard deviation is known or sample size is greater than 30 units Confidence level is (1 - a); ais proportion in tails outside confidence interval Here for a confidence level of 95% proportion in tail is 5% Sample confidence intervals given by: Thus population mean lies in the range Confidence interval for finite population is (Finite population multiplier must be applied)
STATISTICS FOR BUSINESS (Estimating population characteristics) Turkey and the margin of error Sample size for estimating the mean In sampling from a Normal distribution: Difference between sample mean and true mean, the sample error, or confidence limit. (Note it is ±) Reorganising making n the subject gives, If the sample error is denoted by e then: Then the sample size is given by the equation Thus for a given percentage confidence level (which dictates z), and a given confidence limit the required sample size can be determined.
STATISTICS FOR BUSINESS (Estimating population characteristics) Turkey and the margin of error Student-t distribution • In sampling where the Normal distribution can be applied: • As sample size increases closer the sampling distribution of the mean approximates a Normal distribution • This is consequence of the the Central Limit Theory • When sampling distribution of the mean is normal we can apply the Normal theory for analysis. • If population distribution is normal then regardless of sample size • Sampling distribution of the means will be normal • If population distribution is not normal: • Sample size of at least 30 should be taken to obtain a sampling distribution of the means that is normal If sample size is small, less than 30 units, population distribution is not normal; population standard is unknown Compared to large sample sizes, there will be a larger dispersion around the true population parameter : Using a Student-t distribution helps give confidence for this type of analysis
STATISTICS FOR BUSINESS (Estimating population characteristics) Turkey and the margin of error Characteristics of Student-t distribution Used for sample sizes less than 30. Population standard deviation is unknown Developed by William Gossett of the Guinness Brewery, Dublin, Ireland in the early 1900s Shape is similar to normal distribution curve in that it is bell-shaped and symmetrical) Compared to a Normal distribution, a Student-t distribution is lower at the mean, and higher in the tails There is a different Student t-distribution for each sample size or each degree of freedom.. As sample size becomes 30 or more we can use the Normal distribution
STATISTICS FOR BUSINESS (Estimating population characteristics) Turkey and the margin of error Degrees of freedom • If mean of two values A, and B, is 22; If A = 16, then B has to be 28 • (A + B)/2 = 22 • (16 + B)/2 = 22 • B = 44 – 16 = 28 • That is, the degree of freedom for on element, B, is lost • Here 2 elements, and 1 degree of freedom We have an equation A + B + C + D + E = 95 We can specify any 4 values say A = 12; B = 22; C = 9; D = 31 The 5th is fixed. It has to be 21 to satisfy the equation Here 5 elements and 4 degrees of freedom For sample size, n, there are (n - 1) degrees of freedom
STATISTICS FOR BUSINESS (Estimating population characteristics) Three student-t distributions for different sample sizes Three different Student-t distributions • Sample size of 6; degrees of freedom = 5 • Sample size of 12; degrees of freedom = 11 • Sample size of 22; degrees of freedom = 21 Turkey and the margin of error
STATISTICS FOR BUSINESS (Estimating population characteristics) Turkey and the margin of error Comparing the Normal distribution with the Student-t distribution Normal distribution is higher at peak and closer to x-axis than the t-distribution
STATISTICS FOR BUSINESS (Estimating population characteristics) Turkey and the margin of error • Use Student t distribution when: • Population standard deviation is unknown • Sample size is less than 30 • Confidence level is (1 – a) • In using Excel: • Enter probability outside or confidence level a • Degrees of freedom, which is (n - 1) Estimating with t-distribution for a sample size of n units Mean Confidenceinterval A Student-t distribution For each degree of freedom Like z in the Normal distribution, t can be ± since distribution is symmetrical
STATISTICS FOR BUSINESS (Estimating population characteristics) Turkey and the margin of error Confidence intervals using sample data and Student t-distribution
STATISTICS FOR BUSINESS (Estimating population characteristics) Turkey and the margin of error Auditing: Estimating the population total amount Population total amount is Sample mean value Population size For small samples, where standard deviation is unknown: Confidence interval estimate for the total is
STATISTICS FOR BUSINESS (Estimating population characteristics) Turkey and the margin of error Confidence interval estimate for the proportion Upper confidence interval estimate is Lower confidence interval estimate is p is population proportion If population proportion is unknown then use sample proportion
STATISTICS FOR BUSINESS (Estimating population characteristics) Turkey and the margin of error Sample size for proportion Reminder: In sampling from a Normal distribution: Difference between sample mean and true mean, the sample error, or confidence limit. (Note it is ±) For a proportion Thus Squaring both sides Sample size If we do not know p, use Alternatively set p = 0.5 to give most conservative (largest) sample size.
STATISTICS FOR BUSINESS (Estimating population characteristics) Turkey and the margin of error When we make estimates the question arises, “How good is the estimate?” That is, what is the margin of error? Margin of error measures the maximum amount that our estimate differs from the population parameter Value of z is set by confidence level Margin of error for the mean (Same as confidence intervals) Margin of error for the proportion • Note high confidence level does not give a higher accuracy • To have a higher confidence level we have large intervals • With large intervals we have a large margin of error