Understanding Margin of Error: Population vs. Sample in Polling
This discussion explores the distinction between a population and a sample in statistical polling, illustrated with real-world examples. We explain the concept of Margin of Error (MOE), which quantifies uncertainty in estimates and reflects how closely a sample proportion aligns with the population proportion. Utilizing CNN polls on President Bush's approval ratings as case studies, we calculate MOE for two different polls and analyze the reasons behind varying results. This comprehensive overview highlights the importance of sample size and its impact on the accuracy of polling data.


Understanding Margin of Error: Population vs. Sample in Polling
E N D
Presentation Transcript
Discuss with a partner the difference between a POPULATION & a SAMPLE; Give three examples of each… POPULATION SAMPLE 1. 1. 2. 2. 3. 3. Recap…
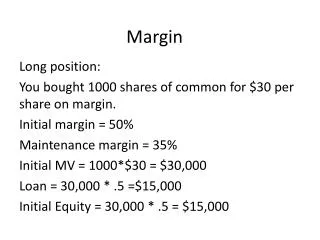
A value that tells the uncertainty in our estimate. • A measure of how close we believe the SAMPLE proportion is to the POPULATION proportion. • Formula used to predict MOE with 95% confidence ≈ 1 √n What is a Margin of Error (MOE)?
During the week of 8/10/01, CNN conducted a poll asking 1000 Americans whether they approve of President Bush’s performance as President. The approval rating was 57%. In their next poll conducted during the week of 9/21/01, CNN conducted the same poll asking 100 Americans whether they approve of President Bush’s performance as President. The approval rating was 90%. Example
Why the difference in ratings? • Find the MOE in the August poll. • Find the MOE in the September poll. • Explain why the MOE for the August poll in less than that in September.