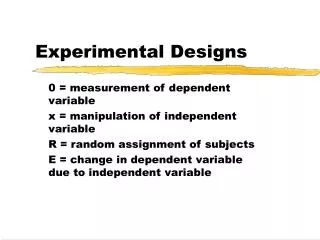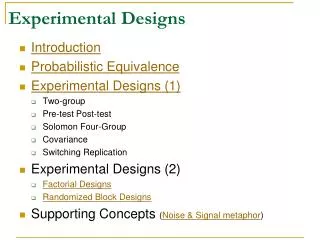
Experimental designs
Experimental designs. But even this design does not prove causality. I would still use Other methods (triangulation –convergent methods) to explore the Impact of the program on change. Non-experimental pre-experimental quasi-experimental experimental

Experimental designs
E N D
Presentation Transcript
But even this design does not prove causality. I would still use Other methods (triangulation –convergent methods) to explore the Impact of the program on change. Non-experimental pre-experimental quasi-experimental experimental No time ordertime order variable time order variablestime order var Single group no manip of I.V. manipulated IV manipulate IV No control grp single group control group or control control group self-control pre/post thru repeated measures no random assignment random assignment RESEARCH done After program completion 0 X 0 LOW INTERNAL VALIDITY HIGH Answers ?#2 Did the clients in the program Get better, after they were in the program? X 0 Answersd ?#3 Did the clients get Better because They were in the Program? Answers ?#1 Did the clients in The Program Get better ?
The true experimental design is considered the “gold standard” for evidence of treatment effectiveness. It meets all three conditions for establishing causality. 1. the cause comes before the effect. 2. the IV and DV are correlated and empirically related. 3 other causes are ruled out (by) Non-experimental pre-experimental quasi-experimental experimental No time order time order variable time order variables time order var Single sample no manip of I.V.manipulated IV manipulate IV No control grp single groupcontrol or control group controls or control grp no random assignment random assignment Random selection maybe random selection maybe repeated measures SURVEY RESEARCH LOW INTERNAL VALIDITY HIGH
Experimental research designs are the only Research where one can say with reasonable certainty that the intervention CAUSED the change in the dependent variables. WHY? 1. experimental research makes sure, that if there is a change, it occurs after treatment and in relation to the treatment 2. it controls threats to internal validity –makes sure that nothing else causes the change Here is the simplest experimental design R 01 X 02 R 01 X 02 There are a number of other experimental designs- gold standard in science for evidence
Randomized clinical trials or RCTs is another phrase that refers to a true experimental design that is used to “verify” or prove the effectiveness of a particular treatment or medication. RCTs are the gold standard of medicine. A randomized controlled trial (RCT) is a scientific procedure most commonly used in testing medicines or medical procedures. RCTs are considered the most reliable form of scientific evidence because it eliminates all forms of spurious causality-that is they control most of any design for threats to internal validity. They are sometimes known as Randomized Clinical Trials RCTs are mainly used in clinical studies, but are also employed in other sectors such as judicial, educational, social research. Clinical RCTs involve allocating treatments to subjects at random. This ensures that the different treatment groups are 'statistically equivalent'.
Trials are used to establish average efficacy of a treatment as well as learn about its most frequently occurring side-effects. This is meant to address the following concerns. First, effects of a treatment may be small and therefore undetectable except when studied systematically on a large population. Second, biological organisms (including humans) are complex, and do not react to the same stimulus in the same way, which makes inference from single clinical reports very unreliable and generally unacceptable as scientific evidence. Third, some conditions will spontaneously go into remission, with many extant reports of miraculous cures for no discernible reason. Finally, it is well-known and has been proven that the simple process of administering the treatment may have direct psychological effects , sometimes very powerful; the placebo effect.
Randomized clinical trials are “true experiments” according to their research design.That is, they control for threats to internal validity through 1. time ordering of variables 2. manipulating the independent variable (experimental and control group) and 3. randomizing assignment to groups. Why randomize 1. we want the groups to be similar in all respects EXPECT, the ine being studied 2. randomizing SHOULD distriburte threats to internal vailidty equally between both groups! A randomized clinical trial uses controlled laboratory conditions – rather than real world conditions in its experiment. In reality it is very hard to raqndomly assign participants to a program and to NO program
Review • All outcomes evaluations use comparisons! • Effective compared to what • Better compared to what • Achieved our outcomes compared to what
I can compare with standards that are set • I can compare the clients on a pre-established ACCEPTABLE MEASURE OF AN OBJECTIVE – a historical standard. THIS MIGHT BE CALLED AN OUTCOME STANDARD! • I can compare the clients on SOCIAL INDICATORS with other parts of the area, state, country. • I can compare clients on OUTCOME VARIABLES (DEPENDENT VARIABLES), INDICATORS OR STANDARDS with a SET OF STANDARDS set by an organization, best practices etc. For example. “students will have scored 400 on the MAT” • I can compare clients on OUTCOME VARIABLES (DEPENDENT VARIABLES), INDICATORS OR STANDARDS established in the review of literature. For example, for a substance abuse program: “50% of all program graduates had not relapsed at 12 month follow, based on monthly urine screens.” • Standards are set by the informed guesses of stakeholders
Here is an example of a comparison to an outcome standard COMPARISON TO A PRE-ESTABLISHED OUTCOME STANDARD. (This applies also to using social indicators, sets of standards or best practices and outcomes suggested by a literature review!!) EXAMPLE: Outcome standard for a classroom-based reward system designed to help teachers deal positively with behavior problems = Referrals to the principal’s office will be reduced 50% the first year. Grp 1 = Program groups (all classes). O1 X O2 Grp 2 = Standard serves as control grp. --------- O2= 50% reduction of O1 In this design O1 = the number of referrals to principal in the year before the program and O2 = the number of referrals in the year since the program started. O1 is the same as O1! That is the number of referrals before the program. However O2 = the calculation of a 50% reduction of O!. Then O2 is compared to O2. For example, say O1 = 350 referrals. A 50% reduction would be 175 referrals; so O2 = 175. Thus in this design, O2 is compared to 175 (O2).
ANOTHER EXAMPLE = COMPARISON TO A STANDARD FOUND IN THE LITERATURE REVIEW You have a program in hospice that is a ‘bereavement program’. In that program, two of your objectives are 1. to reduce depression in survivors and 2. to reduce social isolation in survivors. In doing a literature review, you find that 25% of all depressed mourners are naturally no longer depressed after six months (this means that 25% get better with no treatment). You also find that one quarter of those mourners who are socially isolated and lonely at the time of the loved ones death are naturally no longer as socially isolated lonely after six months. SO YOUR COMPARISON WOULD BE THAT YOU WOULD EXPECT GREATER THAN 25% IMPROVEMENT ON MEASURES OF THOSE TWO OUTCOME VARIABLES!!!! Grp 1 = all members of the bereavement groups O1 X O2 Grp 2 = literature standard serves as control ------- O2 = >25% reduction of O1 In this design O1 = the beginning score – at the time of entry into the group - on the “Beck’s Depression Inventory” and the “UCLA Loneliness Scale” beginning score O2 = Scores on the BDI and UCLALS at six months. However O2 = significantly more than 25% of group members will be less depressed and less lonely at six months after loss.If we have 100 people go through our group in a year, then we would expect significantly more that 25 members to be better on measures of depression and loneliness. ALSO we would expect those more than 25 people to be SIGNIFICANTLY BETTER on measures of depression and loneliness.
Based on the literature review we would expect the following results! • significantly more than 25 members(significance as determined statistically by the probability that such results could occur randomly) who are less depressed and less lonely at six months. • those who are less depressed and less lonely are significantly less depressed and less lonely (significance as determined statistically by the probability that such results could occur randomly). • depression and loneliness are ‘operationalized’ by the score on two standardized tests.
And I can compare to people 6. I can compare clients on OUTCOME VARIABLES (DEPENDENT VARIABLES) with another similar program. 7. I can compare clients To themselves on OUTCOME VARIABLES (DEPENDENT VARIABLES), BEFORE THE PROGRAM, DURING THE PROGRAM AND AFTER THE PROGRAM. 8. I can compare clients to themselves on OUTCOME VARIABLES (DEPENDENT VARIABLES), BEFORE THE PROGRAM AND AFTER THE PROGRAM • I can compare the clients on OUTCOME VARIABLES (DEPENDENT VARIABLES) with a group of clients who are not going through the program. Non-randomized control group • I can randomly assign clients to a program group and a control group and compare each to themselves before and after as well as compare the program group to the control group after.