
Uploaded by
lawrence-stephenson
1 SLIDES
106 VIEWS
10LIKES
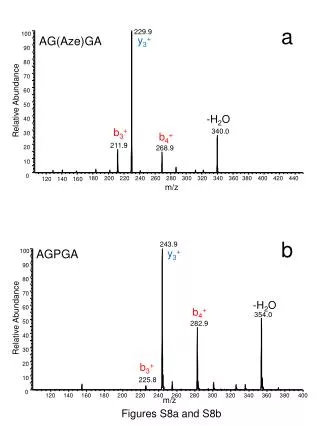
Relative Abundance of Ions in AGPGA Peptide Fragmentation
DESCRIPTION
Explore the mass spectrometry data showing the relative ion abundance of AGPGA peptide fragments at various m/z values. Figures S8a and S8b depict the y3+ and b3+ ions with -H2O, b4+ and y3+ ions, b.-H2O, and b4+ and b3+ ions, respectively.
Download
1 / 1
Download Presentation 
Relative Abundance of Ions in AGPGA Peptide Fragmentation
An Image/Link below is provided (as is) to download presentation
Download Policy: Content on the Website is provided to you AS IS for your information and personal use and may not be sold / licensed / shared on other websites without getting consent from its author.
Content is provided to you AS IS for your information and personal use only.
Download presentation by click this link.
While downloading, if for some reason you are not able to download a presentation, the publisher may have deleted the file from their server.
During download, if you can't get a presentation, the file might be deleted by the publisher.
E N D
Presentation Transcript
229.9 100 90 80 70 60 243.9 100 Relative Abundance 50 90 80 40 70 60 354.0 340.0 Relative Abundance 30 50 282.9 40 211.9 268.9 20 30 20 10 10 225.8 0 120 140 160 180 200 220 240 260 280 300 320 340 360 380 400 m/z 0 180 200 220 240 260 280 300 320 340 360 380 400 420 440 120 140 160 m/z a AG(Aze)GA y3+ -H2O b3+ b4+ AGPGA y3+ b -H2O b4+ b3+ Figures S8a and S8b

More Related