Download

1 / 23
230 likes | 367 Views
Statistical Process Control & Metrics. Suggestions to alter perceptions of the value of testing. Mike Jarred & Ilca Moussavou. Common challenges (perception & value) for Test Managers to solve. A problem shared….

E N D
Statistical Process Control & Metrics Suggestions to alter perceptions of the value of testing.Mike Jarred & Ilca Moussavou
Common challenges (perception & value) for Test Managers to solve
A problem shared… • World Quality Report 2012 – Sogeti / HP (global survey of more than 1500 CIO’s, CFO’s, IT and QA Directors) • Less than 5% of firms regard their testers as best in class – “is it really that low, or perception?” • Testing needs to be a formalised step in the application lifecycle “we still see instances of the testing function being considered as an afterthought or viewed as a roadblock preventing application deployment • So, this is what our bosses are saying about us… • What can we do to address this perception – this is their reality
Demonstrate and gain recognition of the value of testing • If there is no measure of the protection / assurance testing provides to the business this inevitably raises a question of value • Often there are only limited existing measures; e.g. time in test per project, and defect data raised by projects. • Introduction of Test Effectiveness Metric (aka Defect Leakage, with a positive spin - if your figures are good!) • Test Effectiveness = defects found in test as percentage of defects found by test and customers • Demonstrate per product line the Test Effectiveness, with improvement over time • A communication process for this will be covered later in the slide deck… • Gain advocates – for example a Support Manager or Product Manager • They feel the pain if test don’t add value • They understand the impact of good testing on their departments, the organisation and customers
Changing the perception of test • Testing can be perceived as a bottleneck • Capture time to demonstrate how much effort is applied to rework (or, WASTE!) • Introduction of Initial Build Quality (IBQ) (% of tests that pass FIRST time they are run, for new functionality and regression) • IBQ = 50 tests executed, 25 pass, 25 fail = 50% IBQ – measure of development process. • Introduce daily reporting that shows the trends of Quality & Progress over time of the project – constraints to test progress easily demonstrable. IncreasingVisibility & Predictability = value add! • Start reporting these metrics only on the high risk / critical projects • Once the opportunity cost (e.g. less projects being tested) is understood by Executive, testing no longer seen as a bottleneck, but the solution is to the left of testing in the lifecycle
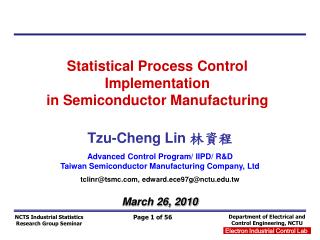
Demonstrate rework levels impact on available test resource: illustrative slippage due to rework Effort (Hours) Date
Raising value awareness – Internal Conference? • Examine possibility of promoting ideas internally, e.g. a conference day • Invite VP’s, Sales, Marketing, Product Management, Project Management, Development, Support (any key stakeholders and advocates who provide “internal independent references” for testing) • Make testers feel valued, and grow profile of the test group. • Market this internally the same way an external events company would promote a conference, add external speakers to add credibility / gravitas • This can significantly raise the profile of testing… • Demonstrate increased test effectiveness with an increase of workload (if this is a reality it often is…) • Demonstrate IBQ, discuss the impact on test resourcing and waste • Discuss, amongst other things, how testing could support quality further given understanding of customers needs / want / perception
Inform Executive Team so cross departmental targets can be set • Create awareness that departmental improvements need to support other departments, and relate to strategic business goals • Propose, and take ownership of running a Metrics Governance Board. • Snr. Managers representing IT & Business – a senior stakeholder ‘owns’ the meeting (but testing run it…) • Executive summary used by senior management in leadership team meeting with CEO • Reporting for all Products - processes needed base lining • Unit Test Coverage & IBQ, Overall Quality (Development Process Measures) • Test Effectiveness (Test Process Measure) • Support metrics – support SLA achievement • Once Performance baselines are understood, targets for improvements can beset.
Statistical Process Control (SPC) • Simple approach to quality control and process improvement involving statistical data analysis • SPC consists of: - Measuring of a process (using objective data) - Eliminating variation due to assignable causes - Regular monitoring of a process - Improving the process to its best target value • Tool Used: Control Chart • Total Variation = Common Cause Variation + Special Cause Variation
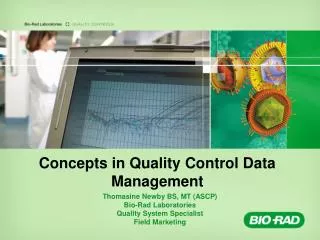
Statistical Process Control – Day to day example Special Cause Variation E.g.: Heavy Traffic, Accident on the road, Woke up late
Ensure SDLC improvements support business goals • Root Cause Analysis of control limit breaches drives change to process to reach departmental targets.
Statistical Process Control - Benefits a) Continuous Process Improvement b) Process Baselines c) Early visibility and reaction d) Quantitative Management Decision Making e) Economical Value
Does this make me a bad parent? • Pocket money is earned , and lost , in 5 pence increments depending on behaviour Sunday is count-up day - and root cause analysis…!
Building Trust - Credibility of Metrics • Metrics provided by SPC need credibility • Show a Governance Board the following; • Approach taken in capturing data, including the source of data • Historic data, (up to 4 years old) that not only provide the baseline but show outliers (events) in the corporate memory they recognise, so future outliers will be trusted. • The data is usuallyavailable in Quality Centre & other management toolsets– it is simply a case of extracting it and presenting the information.
Target Setting • Initial targets set, across the SDLC • Targets set using historical data, with attention to the previous 6 – 9 months • As the targets are set using detailed knowledge, the targets are seen as fair and reasonable • Target setting should involve the ‘customer’ of the process; e.g. IBQ is a measure of development build – Test can set expectations of acceptable quality as a development target. Support can set the target for test effectiveness
The vision - transition of testing to “agents of change” • Test can have a credible voice at the top table, with authority to challenge conventional thinking • Process improvements across the organisation can be driven through testing and the information the function provides • Test Group can position itself positioned as the ‘trusted advisor’ - seen by execs as the advocates in improvements to the SDLC… • Metrics Governance Board can trigger improvement initiatives to • Increase predictability of project outcomes • Improve quality of software into test • Move towards defect prevention culture • Our conference output has seen major investment in performance, security & business analysis to improve usability and quality of products.
Success Factors • Standardised Testing Methodology, consistently applied • Standardised testing tools and SDLC tools to capture Data surrounding your process. Ability to extract the data from QC database. • Establish responsibilities for data capture, presentation & utilisation. • Change the culture – use advocates / champions outside your group help… • Good communication (top / down / sideways). Create feedback loops • Access to a mathematician if you don’t have “an Ilca” - tools like Minitab for SPC • Ensure sponsorship – work out what is important to your sponsor and how this would help them achieve their goals. You’ll probably get permission. If not, do it anyway - you may be seen as innovative… • Keep it simple – Senior Exec’s don’t have the time for detail, or necessarily understand the detail… • Stress metrics are used for process improvement – not individual performance management (there is no quicker way to derail any inertia!)
Closing thoughts • You already have lots of data – use it to sell and tell a story • Everybody has a process, even agile teams! – it’s about measuring what you feel is significant in your process to see if it can be improved… • Ensure the information is credible • Be aware that metrics can drive behaviour (not always favourably) Use industry information and compare – blow you own trumpet when you smell a success story (e.g. WQR only 5% companies achieve 100% ROI on automation) – build your case, no one will be able to confidently challenge (you are the experts!)