Download

1 / 3
30 likes | 113 Views
Explore farm size and agriculture commodities trends over time in North Carolina with data from NSF Long-Term Ecological Research sites. Learn how to interpret and utilize the data effectively. This resource provides insights into the changing landscape of agrarian lands. Visit the provided link for more information.

E N D
Printed with permission from the following National Science Foundation Long Term Ecological Research sites involved in the Agrarian Lands in Transition (http://ces.asu.edu/agtrans/) grant (#DEB-0216560): CAP, CWT, HFR, KBS, KNZ, SGS Data:How to Read It How to Use It Data:How to Read It How to Use It 3
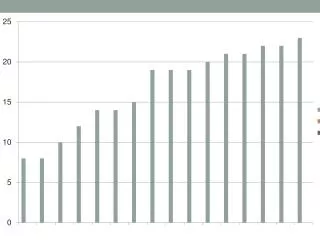
Printed with permission from the following National Science Foundation Long Term Ecological Research sites involved in the Agrarian Lands in Transition (http://ces.asu.edu/agtrans/) grant (#DEB-0216560): CAP, CWT, HFR, KBS, KNZ, SGS Both of these graphs show data on farm size and number of farms over time in North Carolina. What trends you notice? Which chart is easiest to read and why? Coweeta, North Carolina: Number and Size of Farms
This table shows the agriculture commoditiesadopted by the Cherokee in North Carolina.Construct a chart/graph that is easier to read. Printed with permission from the following National Science Foundation Long Term Ecological Research sites involved in the Agrarian Lands in Transition (http://ces.asu.edu/agtrans/) grant (#DEB-0216560): CAP, CWT, HFR, KBS, KNZ, SGS