Download
1 / 63
640 likes | 691 Views
Learn to assess NPV estimates and analyze risk factors in discounted cash flow projects. Understand scenario analysis, break-even points, and use different tools to evaluate project viability. Delve into sensitivity and simulation analyses to make informed decisions.

E N D
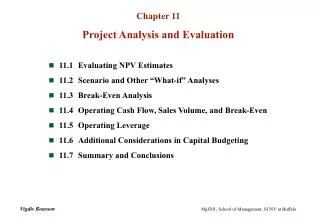
Topic 6PROJECT ANALYSIS AND EVALUATION 6.1. Evaluating NPV Estimates 6.2. Scenario and Other What-If Analyses 6.3. Break-Even Analysis 6.4. Operating Cash Flow, Sales Volume, and Break-Even 6.5. Operating Leverage 6.6. Capital Rationing
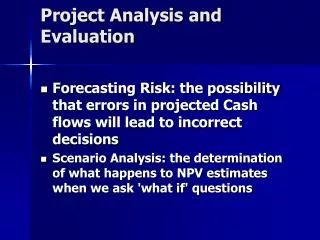
6.1. Evaluating NPV Estimates Suppose we are working on a preliminary discounted cash flow analysis. We identified the relevant cash flows and finally we estimated that the NPV is positive. Are we sure everything is fine? The key inputs into a DCF analysis are projected future cash flows. If the projections are seriously in error the resulting answer can still be grossly misleading.
6.1. Evaluating NPV Estimates The possibility that errors in projected cash flows will lead to incorrect decisions is called forecasting risk (or estimation risk). One of our goals is to develop some tools that are useful in identifying areas where potential errors exist and where they might be especially damaging.
6.1. Evaluating NPV Estimates The first line of defense against forecasting risk is simply to ask, “What is it about this investment that leads to a positive NPV?” We should be able to point to something specific as the source of value. For example, if the proposal under consideration involved a new product, then we might ask questions such as the following:
6.1. Evaluating NPV Estimates Are we certain that our new product is significantly better than that of the competition? Can we truly manufacture at lower cost, or distribute more effectively, or identify undeveloped market niches, or gain control of a market? These are just a few of the potential sources of value. There are many others.
6.2. Scenario and Other What-If Analyses What happens to the NPV under different cash flows scenarios? At the very least look at: Best case – high revenues, low costs Worst case – low revenues, high costs Measure of the range of possible outcomes Best case and worst case are not necessarily probable, but they can still be possible
6.2. Scenario and Other What-If Analyses New Project Example The initial cost is $200,000 and the project has a 5-year life. There is no salvage. Depreciation is straight-line, the required return is 12% and the tax rate is 34%. Depreciation per year is $40,000 ($200,000/5).
6.2. Scenario and Other What-If Analyses With this information we can calculate the base-case NPV by first calculating net income
6.2. Scenario and Other What-If Analyses OCF = EBIT + D – Taxes = = $30,000 + 40,000 – 10,200 = $59,800 per year. The project has a 5-year life and a 12 percent required return, so the base-case NPV is: NPV=- 200 000 + 59 800 x{1 -[1/(1+0,12)5]/0,12 = = $15 567 NPV is positive and the project looks good.
6.2. Scenario and Other What-If Analyses Base-case NPV = $15.565,62
6.2. Scenario and Other What-If Analyses The determination of what happens to NPV estimates when we ask what-if Questions is scenario analysis. To get the worst case, we assign the least favorable value to each item. This means low values for items like units sold and price per unit and high values for costs. We do the reverse for the best case.
6.2. Scenario and Other What-If Analyses Worst-case NPV = -$111.719,03
6.2. Scenario and Other What-If Analyses Best-case NPV = $159.504,33
6.2. Scenario and Other What-If Analyses Summary of Scenario Analysis
6.2. Scenario and Other What-If Analyses Sensitivity Analysis For Unit Sales What happens to NPV when we vary one variable at a time. This is a subset of scenario analysis where we are looking at the effect of specific variables on NPV. The greater the volatility in NPV in relation to a specific variable, the larger the forecasting risk associated with that variable and the more attention we want to pay to its estimation.
6.2. Scenario and Other What-If Analyses Sensitivity analysis is an investigation of what happens to NPV when only one variable is changed. To illustrate how sensitivity analysis works, we go back to our base case for every item except unit sales. We can then calculate cash flow and NPV using the largest and smallest unit sales figures.
6.2. Scenario and Other What-If Analyses Summary of Sensitivity Analysis for New Project
6.2. Scenario and Other What-If Analyses Simulation Analysis Simulation is really just an expanded sensitivity and scenario analysis. Monte Carlo simulation can estimate thousands of possible outcomes based on conditional probability distributions and constraints for each of the variables. The output is a probability distribution for NPV with an estimate of the probability of obtaining a positive net present value. The simulation only works as well as the information that is entered and very bad decisions can be made if care is not taken to analyze the interaction between variables.
6.2. Scenario and Other What-If Analyses Making A Decision Beware “Paralysis of Analysis” At some point you have to make a decision. If the majority of your scenarios have positive NPVs, then you can feel reasonably comfortable about accepting the project. If you have a crucial variable that leads to a negative NPV with a small change in the estimates, then you may want to forego the project.
6.3. Break-Even Analysis Common tool for analyzing the relationship between sales volume and profitability. There are three common break-even measures: Accounting break-even – sales volume at which net income = 0 Cash break-even – sales volume at which operating cash flow = 0 Financial break-even – sales volume at which net present value = 0
6.3. Break-Even Analysis There are two types of costs that are important in breakeven analysis: variable and fixed: • Total variable costs = quantity × cost per unit • Fixed costs are constant, regardless of output, over some time period • Total costs = fixed + variable = FC + v×Q
6.3. Break-Even Analysis Total variable costs (VC) = = quantity (Q) × cost per unit (v) Example: You produce 1000 units and you also pay $2 per unit to produce your product. VC = Q × v = 1000 × 2 = 2000 If you produce 5000 units variable costs: VC = Q × v = 5000 × 2 = 10000
6.3. Break-Even Analysis Total costs(TC)=fixed costs(FC)+variable costs(VC)= TC = FC + v×Q Example: • Your firm pays $8000 per month in fixed costs. You also pay $3 per unit to produce your product. • What is your total cost if you produce 1000 units? • What if you produce 5000 units? • What if you produce 10000 units? TC = 8000 + 3×1000= 11000 TC = 8000 + 3×5000= 23000 TC = 8000 + 3×10000= 38000
6.3. Break-Even Analysis Average Cost = TC / # of units Will decrease as # of units increases Marginal Cost The cost to produce one more unit Same as variable cost per unit Example: What is the average cost and marginal cost under each situation in the previous example Produce 1000 units: Average=11000/1000 = $11 Produce 5000 units: Average=23000/5000=$4.60 The marginal cost of producing one more unit is $3.
6.3. Break-Even Analysis Accounting Break-Even What sales level gives $0 net income (assuming things are the same each year)? This happens when sales equal total costs. P = $5 price per unit v = $3 variable cost per unit Q = 450 # of units or quantity FC = $600 fixed costs D = $300 depreciation, T = 34 % tax rate
6.3. Break-Even Analysis Accounting Break-Even (Q = 450 units)
6.3. Break-Even Analysis Net income = sales – costs – taxes NI = [Q×P – FC – Q×v – D](1 – T) = 0 Divide both sides by ( 1 - T) to get Q×P – FC – Q×v – D = 0 Q×P – Q×v = FC + D Q×(P – v) = FC + D Q = (FC + D) / (P – v) The difference between the selling price and the variable cost (P – v) is often called the contribution margin per unit.
6.3. Break-Even Analysis Accounting break-even is often used as an early stage screening number. If a project cannot break-even on an accounting basis, then it is not going to be a worthwhile project. Accounting break-even gives managers an indication of how a project will impact accounting profit.
6.4. Operating Cash Flow, Sales Volume, and Break-Even We are more interested in cash flow than we are in accounting numbers. As long as a firm has non-cash deductions, there will be a positive cash flow. If a firm just breaks-even on an accounting basis, operating cash flow = depreciation If a firm just breaks-even on an accounting basis, NPV < 0
6.4. Operating Cash Flow, Sales Volume, and Break-Even To illustrate, suppose the Wettway Sailboat Corporation is considering whether or not to launch its new Margo-class sailboat. The selling price will be $40,000 per boat. The variable costs will be about half that, or $20,000 per boat and fixed costs will be $500,000 per year.
6.4. Operating Cash Flow, Sales Volume, and Break-Even The Base Case. The total investment needed to undertake the project is $3,500,000. This amount will be depreciated straight-line to zero over the five-year life of the equipment. The salvage value is zero and there are no working capital consequences. Wettway has a 20 percent required return on new projects.
6.4. Operating Cash Flow, Sales Volume, and Break-Even Wettway projects total sales for the five years at 425 boats or about 85 boats per year. Ignoring taxes should this project be launched? OCF = Sales – Costs – Taxes (Top-Down Approach) OCF = Q×P – Q×v – FC – Taxes OCF = 85×40,000 – 85×20,000 – 500,000 – 0 = =1,200,000 NPV= -3,500,000 + 1,200,000×{1-1/(1+0.2)5]}0.2= = -3,500,000 +1,200,000×2.9906 = 88,720
6.4. Operating Cash Flow, Sales Volume, and Break-Even Calculate the quantity (Q) necessary for accounting break-even. Fixed costs = 500,000 Depreciation = 700,000 = 3,500,000/5 Price per unit = 40,000 Variable cost per unit = 20,000 Q = (FC + D) / (P – v) Q=(500,000+700,000) / (40,000–20,000)= 60
6.4. Operating Cash Flow, Sales Volume, and Break-Even If 60 boats are sold, net income will be exactly 0. OCF= NI + Depreciation (Bottom-Up Approach) OCF = 0 + 700.000 NPV=-3.500.000 +700.000×{1-1/(1+0.2)5]}/0.2= = -3.500.000 + 2.093.429 = - 1.406.571 NPV = 0, if IRR = 0. NPV = -3.500.000 +700.000 +700.000 +700.000 +700.000 +700.000 = 0
6.4. Operating Cash Flow, Sales Volume, and Break-Even Sales Volume and Operating Cash Flow Cash break-even Again, ignore taxes for simplification: OCF = net income + depreciation OCF = [(P – v) × Q – FC – D] + D = = (P – v) × Q – FC For the Wettway sailboat project OCF = (P – v) × Q – FC = OCF = (40,000-20,000) × Q – 500,000
6.4. Operating Cash Flow, Sales Volume, and Break-Even Rearrange the OCF equation and solve for Q OCF = (P – v) × Q – FC Q = (FC + OCF) / (P – v) To find the cash break-even point (where OCF =0): Q = FC / (P – v) = 500,000 / (40,000 -20,000) = Q = 500,000 / 20,000 = 25
6.4. Operating Cash Flow, Sales Volume, and Break-Even Financial Break-Even. To find the financial break-even we have to calculate the sales level that results in a zero NPV. For the Wettway sailboat project: NPV = 0= -3,500,000 + + OCF x {1-1/(1+0.2)5]}/0.2 OCF = 1,170
6.4. Operating Cash Flow, Sales Volume, and Break-Even Q = (FC + OCF) / (P – v) Q = (500.000 + 1.170) / (40.000 – 20.000) = = 83,5 So, Wettway need to sell about 84 boats per year to have NPV = 0 The financial break-even for the Wettway sailboat project is 84 boats
6.4. Operating Cash Flow, Sales Volume, and Break-Even Summary of Break-Even Measures I. The General Break-Even Expression Ignoring taxes, the relation between operating cash flow (OCF) and quantity of output or sales volume (Q) is: FC + OCF Q = --------- P – v where FC = Total fixed costs; P = Price per unit; v = Variable cost per unit; As shown next, this relation can be used to determine the accounting, cash, and financial break-even points.