Download
1 / 13
190 likes | 489 Views
SEHS Topic 6: Measurement and Evaluation of Human Performance. Can you calculate the mean and standard deviation?(must be able to perform it on a Ti-84 or similar calculator) Instructions: http://www.ehow.com/how_8054806_calculate-standard-deviations-ti84s.html.

E N D
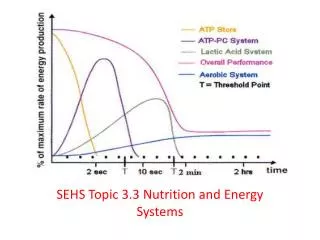
SEHS Topic 6: Measurement and Evaluation of Human Performance
Can you calculate the mean and standard deviation?(must be able to perform it on a Ti-84 or similar calculator) • Instructions: http://www.ehow.com/how_8054806_calculate-standard-deviations-ti84s.html
What do 1 and 2 standard deviations say about a normally distributed data set? • Approximately 68% to 95% of the data values fall within +/- one or two standard deviations of the mean
Deduce the significance of the difference between two sets of data using calculated t-test values • When a t-test can be applied?: • Data should have a normal distribution (aka. a continuous probability distribution ) • every normal curve (regardless of its mean or standard deviation) conforms to the following "rule". • About 68% of the area under the curve falls within 1 standard deviation of the mean. • About 95% of the area under the curve falls within 2 standard deviations of the mean. • About 99.7% of the area under the curve falls within 3 standard deviations of the mean.) * Sample size of at least 10/data set *Used for two-tailed *Paired or unpaired data
T-test Cont’d http://www.ats.ucla.edu/stat/mult_pkg/faq/general/tail_tests.htm
Explain that the existence of a correlation does not establish that there is a causal relationship between two variables • Relationship vs cause • Specificity • There is a relationship between lung cancer and smoking • Is smoking the cause of all lung cancers? • Strong correlation but not necessarily the cause
Proper Study Design • When measuring an individual’s fitness levels it is important to ensure it is done as well as possible • Main factors to take into account: • Specificity(sport specific tests….ex?) • Accuracy(technical/instrument upkeep) • Reliability (the degree to which a measure would produce the same result from one occasion to another)– test after skill is learned completely to avoid habituation effect • Validity(sport specific test and repititions)
Designing sport and exercise science experiments • Cause and effect experimentation • Does taking 20g of creatinephosphate 30 minutes before a resistance training workout produce significant improvement of one’s 1 rep max? • What’s wrong with this design? • How can it be designed better?