Download
1 / 26
260 likes | 449 Views
Using Tools of the Trade with Your Data . Marianne Oakes Kristen Tompeck. Purpose and Objectives. What are some of the tools? How do you use them? Why do you use them? How do you know they work?. Data Considerations. Do we see patterns? Do we have new questions?

E N D
Using Tools of the Trade with Your Data Marianne Oakes Kristen Tompeck
Purpose and Objectives • What are some of the tools? • How do you use them? • Why do you use them? • How do you know they work?
Data Considerations • Do we see patterns? • Do we have new questions? • Do we need more information? • Where will we find it? • What cautions should be considered when reviewing these data?
Improving Decision-Making via Problem Solving Action Planning & Evaluation Problem Solving Problem Solution Information/ Data
Examples: Primary to Precise • 39 of 70 fifth-graders, or 55% are scoring below the 50th percentile on easyCBM PRF at Winter Benchmark. Skill deficits range from lack of prosody to the inability to read multi-syllabic words. Motivation does not appear to be an issue. • 55% of fifth-grade Riverdell students are scoring below the 50th percentile on easyCBM PRF at Winter Benchmark.
“An undefined problem has an infinite number of solutions.” Robert A. Humphrey
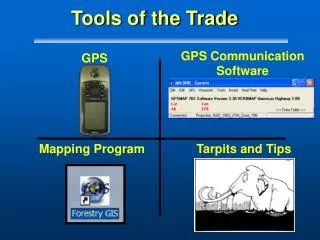
The Tools: Processes and Procedures • Funneling Data • Wagon Wheel • Ishikawa Fishbone • Force Field Analysis • Quadrant Analysis • Data Team Forms
Funneling Data Broadly Explore Successes & Challenges Winnow Data Infer Cause/Effect Relationships SMART Goals Hypothesize Improvement Strategies
Your Turn……….. When and why might you use this tool??
Wagon Wheel Template • Key Variables • 1. • 2. • 3. • 4. • 5. • 6. • 7. • 8. • Possibilities for Analysis • Grade level • Teachers • Student groups/subgroups • Domains/strands • Grades • Courses • Instructional Strategies-Training • Instructional Strategies-Implementation • Years (trends) 8 2 2 7 3 3 6 4 Wagon Wheel Template 5 1 S - 27
1 Students at Low Risk in winter Students making adequate progress Actual vs. allocated time Time in small group instruction Lesson plans with active engagement Instruction in 5 big ideas Participation in grade-level collaboration Objectives clearly articulated to students
Your Turn……….. When and why might you use this tool??
Your Turn……….. When and why might you use this tool??
Force Field Analysis Driving ForcesRestraining Forces Research-based curriculum in place Lesson plans loosely constructed Allocated 90 minute Reading block Limited availability of PD for new teachers Embedded collaboration time weeklyClub responsibilities interfere with collaboration time Coaching available Coaching support not being used Pacing guides in place No evidence of pacing guide use Experienced teacher New to district Action Steps: 1. Coach will provide 1 to 1 PD on Reading curriculum and pacing guide 2. Coach will provide planning and classroom support on an on-going basis 3. Teacher will rearrange schedule to attend all collaboration meetings 4. Teacher will use available resources to ensure that instruction is tied to 5 big ideas and matched to student needs.
Quadrant Analysis Comprehension Fluency
Primary to Precise(your turn) • According to winter Benchmark data, the number of second-grade students at “some risk” of reading failure is increasing. • Some students at “low risk” in fluency do not have adequate comprehension. • Jamaal is struggling to read second-grade material.
Data Considerations • Do we see patterns? • Do we have new questions? • Do we need more information? • Where will we find it? • What cautions should be considered when reviewing these data?
Winnow the Data • Practical Examples from the Field