Download
1 / 29
290 likes | 432 Views
Greenland Environmental Observatory ~ Summit. GEOSummit Science Coordination Office Jack Dibb John Burkhart Roger Bales. Cooperating Agencies:. Summit Camp. 72 o 34’N, 38 o 29’W 3,250 m.a.s.l. Manned year-round since 2003 by at least 4

E N D
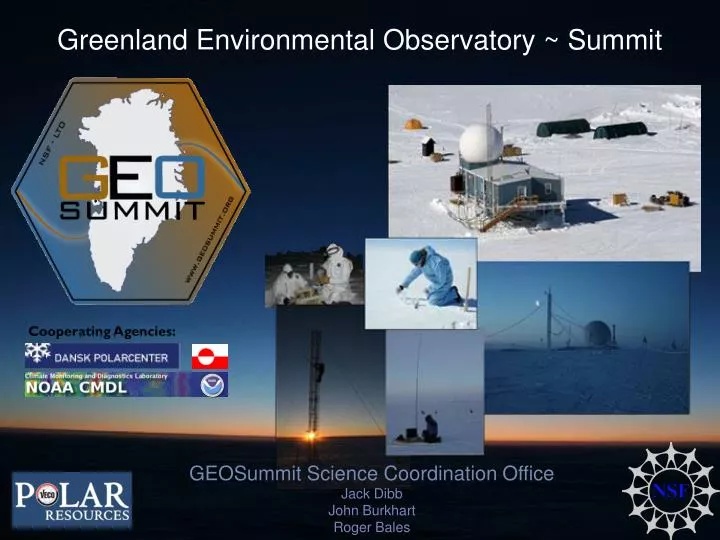
Greenland Environmental Observatory ~ Summit GEOSummit Science Coordination Office Jack Dibb John Burkhart Roger Bales Cooperating Agencies:
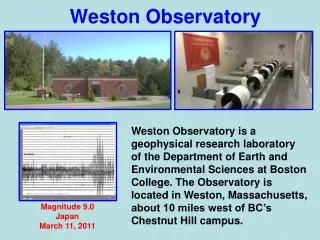
Summit Camp 72o34’N, 38o29’W 3,250 m.a.s.l. • Manned year-round since 2003 by at least 4 • Operated by US NSF OPP under MOU with Denmark and Greenland • Site of GISP2 and GRIP ice cores drilled 1989 - 1993 • Special issue of Atmos. Env. on recent Summit studies in 2007 Dome protecting the ice core drill
Opposing secular trends in CO2 and δ13C reflect anthropogenic input, antiphase seasonality due to C uptake by terrestrial biosphere. Methane and CO show little recent change, yet clear seasonality. N2O and SF6 (minor GH gases) show anthropogenic increases. Year Round Sampling of Trace Gases NOAA ESRL/GMD sampling at Summit demonstrates the value of the site as a unique, high latitude, free troposphere observatory.
Seasonal cycles of hydrocarbons mainly reflect anthropogenic emissions and a weaker winter OH sink Reproducibility of cycles over 8 years indicates source/sink balance, providing sensitive baseline to detect/quantify future changes (Whole air samples analyzed by the D. R. Blake group at UC Irvine) Hydrocarbon Seasonality
All Summit data 2000-2004 Profiles at 4 polar stations are the mean of all available sonde data 1995-2004, X marks the median mixing ratio at Summit. From Helmig et al., 2007 2004 at Summit
Summer peak in 7Be unique at Summit among Arctic sites, indicating significant seasonal influence from the upper troposphere/lower stratosphere 210Pb concentrations decrease with increasing elevation to Summit. Distinct lack of a winter peak confirms that Arctic Haze rarely extends to 3 km altitude over Summit (From Dibb, 2007) 7Be and 210Pb Radionuclides
Filter sampling with 48 hour integration time for the radio-tracers was conducted at Summit in the 1997-98 pilot “overwinter campaign”, again for the 2000-2002 experiment, and since August 2003 to present. Dibb (2007) reported on results through July 2005. Here are observations during the first phase of ARCTAS/ARCIONS. Note that the peak of 7Be in late April is the highest seen since the 2-day sampling interval was initiated in 1997! Unfortunately, NASA airplanes went home, and I believe ARCIONS took a break, on 19 or 20 April.
Everyone came back in the summer for phase 2. Coupling between 7Be and 210Pb even more striking than in April. What does bromide have to do with any of this? Mostly, means I am getting ahead of myself, but for reactive gases it is now well established that Summit is not really a great “free trop” observatory.
In 1998 production of NOx in snow was discovered at Summit (also Alert and South Pole) “Snow Photochemistry” is now a hot topic at Summit, and elsewhere.
We have learned... ..that the way impurities get incorporated into snow (and ice cores) is much a more complex process than we thought! Atmospheric Boundary Layer Turbulent EddyDiffusion PhotochemicalModeling Deposition X XO Windpumping/Turbulent DiffusionModeling Adsorption/Desorption Snow PhotochemicalModeling Actinic FluxModeling X XO Firn Advection/Diffusion Incorporation into Ice Ice More like this model Than this!
Formation Mechanisms?? Organics (Carbonyls) hn hn hn OH O2 Alkenes RONO2 Peroxy Radicals O3 Monocarboxylic Acids Studies in both polar regions, and seasonal snowpacks have confirmed that photolysis of nitrate in snow releases NOx into the firn air. Clearly, OH is enhanced above the snow and is likely even higher in the upper part of the pack. It is not yet clear whether subsequent cycling of N oxides is dominated by homogeneous reactions (in and above the snow) or is mediated by surface chemistry in the porous snowpack. Oxidation of the abundant (but poorly characterized) supply of organic compounds in the snow appears to result in production of a slew of reactive hydrocarbons.
HOx Measurements vs. Model HOx measurements above polar snow are limited, so far, to South Pole, Summit, and Halley. Levels highest at Summit, particularly for OH (summer median values of OH about 4 times higher at Summit than South Pole). Standard models, constrained by observations of presumed main precursors, reasonably simulate HO2 at Summit, but can not capture OH enhancements. Note that model underestimates OH most severely in high winds. From Sjostedt et al. 2007 (in the special issue)
HO Measurements vs. Model (Sjostedt et al., 2007) Obs. HO (1E6 molec./cm3) Obs. HO (1E6 molec./cm3) Note the different scales! Obs. > Model consistently
Composite 24 hr measurements and model predictions of OH during 2003 summer campaign. Predicted values obtained from NMHC model constrained by H2O2, CH2O and HONO from Sjostedt et al., 2007.
A couple more puzzling observations at Summit, particularly when compared to South Pole. Note that Detlev has much more O3 flux data now, confirms the snow/surface is often a sink at Summit. RO2 + NO RO+NO2 BL O3 vertical profile measured at Summit, Greenland by Helmig D.et al.,2007 Ozone production rate due to standard photochemistry from Summit 2003 data
Effect of Bromine Chemistry on Summit Photochemistry • BrO can significantly shift the HO2 and OH partition while has a limited impact on total peroxy radical levels. • BrO does not have significant impact on NO2/NO ratio and is a minor sink for CH2O. • Model estimated net ozone production rates ranges from 0.6, -0.8, to -6 ppbv/day, corresponding to 2, 4, and 10 pptv of BrO. • Near constant O3 observations is consistent with a few pptv of BrO.
HBr Gaseous Phase HO2 HCHO O3 hv GEM (Hgo) BrO Br RGM NO HO2 hv Deposit HOBr hv Br-+ H+ HOBr + Br- + H+ Aqueous Phase 2. Key bromine chemical cycles in polar BL BrO Br2 OH Bromine chemical cycles that induce ozone depletion, mercury depletion and impact the RO2/OH ratio.
G-SHOx May-June ‘07, June-July ‘08 Greenland – Summit Halogens and HOx
Comparison of OH predictions from the HOx-NOx-CH4 modelto OH measurements, plotted with RGM and O3 concentrations. Note the model has trouble when RGM (Br?) is enhanced.
Gas phase soluble Br- in the air just above snow was also generally lower in 2008 than 2007. May be a seasonal feature, but can not rule out interannual variability in transport and/or ambient conditions. Note that soluble Br- shows modest increase in first 2008 CIMS BrO event, but is quite low 20 - 21 June.
Simultaneous measurements above the snow and at 10 cm depth in the snowpack were made on 2 days in 2007. Both cases the mid-day peak was more pronounced in the firn.
In 2008 such measurements were made on 2/3 of all sampling days. Mixing ratios in the firn air were lower in 2008 than 2007, but tended to be higher than those above the snow. Again, firn air enhancement largest in early afternoon. Is the snow one of the sources of Br at Summit?
In the surface layer of snow bromide was always quantifiable, albeit low compared to major ions. If 5 nmol Br kg-1 in the top cm of snow was released to a well mixed 100 m deep boundary layer as a gas the mixing ratio would be ~165 ppt (compare to soluble Br- mainly < 2 ppt). Note that bromide in snow was greatly in excess of the sea salt ratio (based on sodium).
FT partly halogen processed air partly clean partly marine partly BB • strong diurnal variation • long range air mass changes • intermittent BL venting aerosol, gases ~ 300m T gases inversion blowing snow fog gases trapped at night mixed during day Br- Br reservoir is snow atmosphere ~ 1% summer, year -1 Br reactivity Hg Cl reactivity summer, year -2
no Br/Cl influence on VOC no Arctic Haze Early spring no transport processes in blue are critical, need checking!! no elevated Br- in snow pack autumn/winter: - no Br/Cl influence on VOC - no elevated Br- in snow pack Bromine explosion Arctic Haze 1st year sea ice; frost flowers deposition of Bry via snow fall: - Br- peak in summer snow pack - ambient gas and aerosol Bry is “low” Late spring/early summer active photochemistry long-range transport snow pack photochemistry: - release of NOx to air - high snow pack Br- - high Br VOC-reactivity in snow “cold”: production of RGM “warm”: no RGM production Convection (open leads) in low elevation sites, snow-bound RGM might get into aquatic ecosystems during snowmelt Bromine explosion reduction and release of RGM during summer no summer peak in Hg deeper in firn
Coincident DC-8 spiral down over Summit and ARCIONS sonde launch, 5 April, 2008.
Coincident DC-8 spiral down over Summit and ARCIONS sonde launch, 7 July, 2008.