Download
1 / 18
180 likes | 333 Views
Control of Invasive Species: Lessons from Miconia in Hawaii. Kimberly Burnett, Brooks Kaiser, Basharat A. Pitafi, James Roumasset University of Hawaii, Manoa, HI Gettysburg College, Gettysburg, PA. Objectives. Inform public policy decisions for invasive species using economic theory:

E N D
Control of Invasive Species: Lessons from Miconia in Hawaii Kimberly Burnett, Brooks Kaiser, Basharat A. Pitafi, James Roumasset University of Hawaii, Manoa, HI Gettysburg College, Gettysburg, PA
Objectives • Inform public policy decisions for invasive species using economic theory: • Optimal control of an existing invader • Case study from Hawaii…
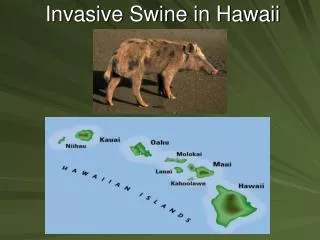
Our case Existing invader: Miconia calvescens
Minimize NPV (Costs+damages) NPV of reducing population to N consists of: 1. Transition cost of reducing the population from to 2. Cost of maintaining population at 3. Damages incurred from remaining at
NPV of increasing population to N consists of:: 1. Transition damage associated with this time and pop’n level 2. Cost of maintaining population at 3. Damages incurred from remaining at Minimize NPV (Costs+damages)
Existing invader: methodology • Choosing Min[V(n0,N)] determines optimal steady state population level N*, corresponding to N0. • N*minimizes costs and damages over time and: • may be smaller (including zero) than the existing population • or larger (including carrying capacity) than the existing population • Is potentially dependent on the current invasion level
Case Study • Growth function g(N) • Damage function D(N) • Control cost function C(N,x)
Miconia: Growth • b, intrinsic growth rate: 0.3 • from analysis of the spread of the tree on Hawaii since 1960s introduction • K, carrying capacity: 100,000,000 • (100 trees per acre over 1 million acres above the 1800 mm/yr rainfall line)
Miconia: Damages • Endangered birds • Households willing to pay $31/ bird species /year to keep a species from extinction (Loomis and White 1996) • Full threat of loss in biodiversity on all islands equivalent to a loss of ½ the endangered bird species → $103-303 mill / year • Watershed • Groundwater recharge losses → $137 million /year (Kaiser and Roumasset 2002) • Increased sedimentation → $33.9 million /year (Kaiser and Roumasset 2000) • Total damages • Estimated average of $377.4 million per year • If any 1 tree equally responsible for its portion of damages, per-tree damage rate of $3.77
Miconia: Control cost • “Search” component • “Treatment” component • 2003: total number of trees controlled on 4 islands: 72,339 • Annual control expenditures $1 million • 72,339 trees removed thought to be less than ¼ of existing population
Miconia: Results (High damages) • Current stock: 400,000 • < • Reduce stock to N* = 31,295 trees, maintain PV losses for N0 = 400,000 D(N)=$2.74N -> 34,202 trees D(N)=$4.88N-> 28,803 trees 0 31,29 5 400 ,000 100 m N (Stationary)
Miconia: Results(Low Damages) • If lower damages, • Global min at N*=31,295, • Local min at N*=100 m • Illustrates need to check both above and below initial population PV losses for N0 0 2.8 k 400 k 4.4 m 100 m N (stationary)
First period removal cost Annual removal cost PV costs Annual damages NPV damages PV (losses) Status quo $1 m $1 m $50 m $369.5 m $12.35 b -$12.4 b Opt policy $6.27 m $449,245 $28.7 m $117,982 $7.4 m -$36.1 m Miconia policy: status quo vs. optimal (win-win)
Summary • Status quo policy welfare equivalent of doing nothing • Optimal control of invasive species requires integrated assessment of bio-economic threat • Growth pattern, control costs, and damages must be estimated as functions of population and removal • Optimal policies dependent on initial population at time of action • Eradication, internal steady state, accommodation all viable outcomes • Catastrophic damages from continuation of status quo policies can be avoided at costs even lower than current spending trajectory
Limitations and direction for further research • Overall: • Sophistication of growth, control cost functions • Accurate anticipation of damages, particularly ecological • Seed bank, spatial dimensions improved