Download
1 / 20
200 likes | 291 Views
Explore the academic progress and school grades of FSUS and Pembroke Pines across the years 2006-2009. Analysis includes reading and math achievements, comparisons with Pembroke Pines, and meeting high standards in various subjects. Discover the data insights and trends in student performance over the years.

E N D
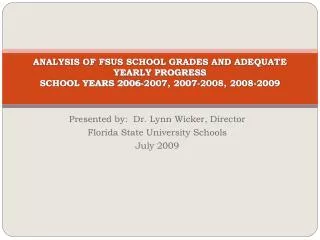
ANALYSIS OF FSUS SCHOOL GRADES AND ADEQUATE YEARLY PROGRESS SCHOOL YEARS 2006-2007, 2007-2008, 2008-2009 Presented by: Dr. Lynn Wicker, Director Florida State University Schools July 2009
FSUS and Pembroke PinesSchool Grades 2006-2007 - FSUS A/567 points Pembroke A/639 points 2007-2008 - FSUS A/573 points Pembroke A/625 points 2008-2009 - FSUS A/566 points Pembroke A/669 points • A = 525 points or more • Meet adequate progress of lowest students in reading and math • Test at least 95% of eligible students
We are proud of the efforts put forth by our students and teachers for consistently gaining a school grade of “A”. However, each year the Department of Education and the USDOE adjusts the school grading and AYP formulas/percentages and therefore it is imperative to continue to raise the bar in our academic achievement levels. The following slides show student achievement data.
% FSUS Learning Gaines READING • 2006/07 62% • 2007/08 68% • 2008/09 63% MATH • 2006/07 76% • 2007/08 78% • 2008/09 74% NOTE: The Low Percentages OF LOWEST 25% READING • 2006/07 61% • 2007/08 60% • 2008/09 62% MATH • 2006/07 72% • 2007/08 73% • 2008/09 67%
FSUS AND PEMBROKE PINES COMPARISONS • Shows percentages for the two schools in our district: FSUS (K-12) and Pembroke Pines (K-5). • The following slides offer data comparisons by category:
% Learning Gaines-Reading FSUS • 2006/07 62% • 2007/08 68% • 2008/09 63% PINES • 2006/07 75% • 2007/08 72% • 2008/09 80% OF LOWEST 25% FSUS • 2006/07 61% • 2007/08 60% • 2008/09 62% PINES • 2006/07 83% • 2007/08 62% • 2008/09 88%
% Learning Gaines-Math FSUS • 2006/07 76% • 2007/08 78% • 2008/09 74% PINES • 2006/07 74% • 2007/08 77% • 2008/09 75% OF LOWEST 25% FSUS • 2006/07 72% • 2007/08 73% • 2008/09 67% PINES • 2006/07 69% • 2007/08 79% • 2008/09 76%
School % 3 and AboveWriting Essay 4th Grade 3.5 and Above • FSUS • 2006 – 75% • 2007 – 63% • 2008 – 66% • 2009 – 65% • PINES • 2006 – 89% • 2007 – 84% • 2008 – 83% • 2009 – 97%
School % 3 and AboveScience 5th Grade FSUS 2006 – 41% 2007 – 59% 2008 – 49% 2009 – 50% PINES 2006 – 55% 2007 – 65% 2008 – 65% 2009 – 61%
Some Lab School Data Comparisons • FAU – A.D. Henderson • FAMU – FAMU Lab School • FSUS – Florida State University Schools • UF – P.K. Younge • KEY: Reading (R), Math (M), Writing (W) Science (S)
% Meeting High Standards READING MATH WRITING SCIENCE
Adequate Yearly Progress (AYP) • 2006-2007 - FSUS made AYP - Yes • 2007-2008 - FSUS made AYP- Yes • 2008-2009 - FSUS made AYP -No